

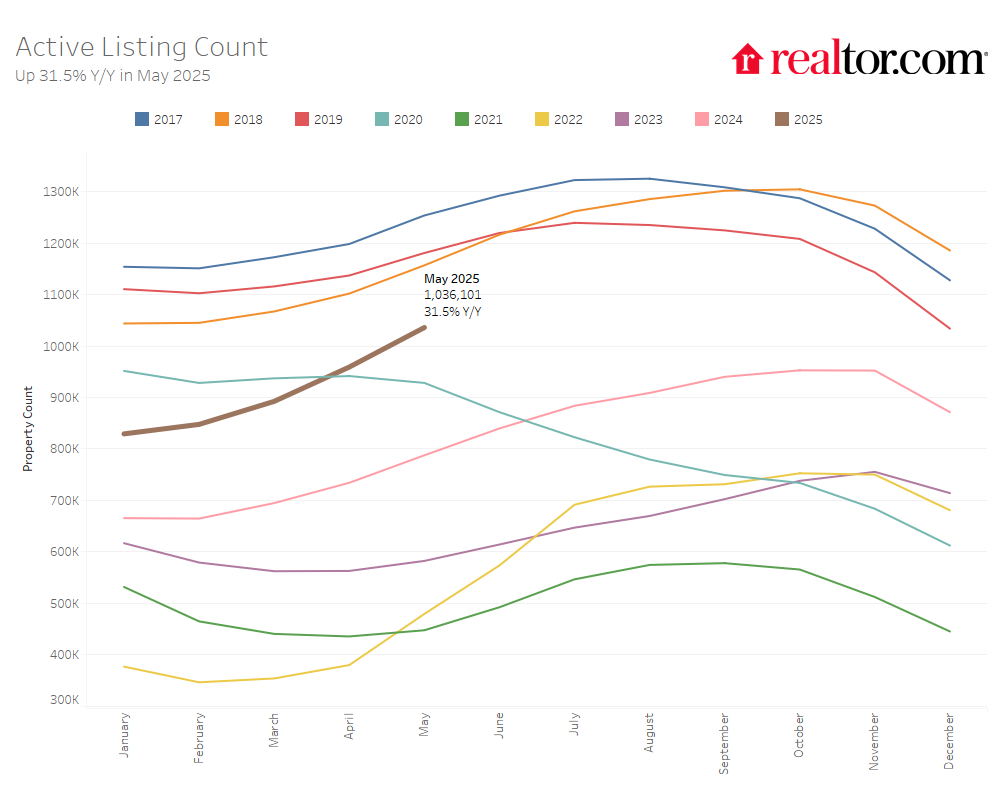
- The inventory of homes for sale rose 31.5% year-over-year, marking the 19th consecutive month of year-over-year inventory growth. May 2025 inventory hit a new post-pandemic high, but remains about 14% below pre-pandemic levels.
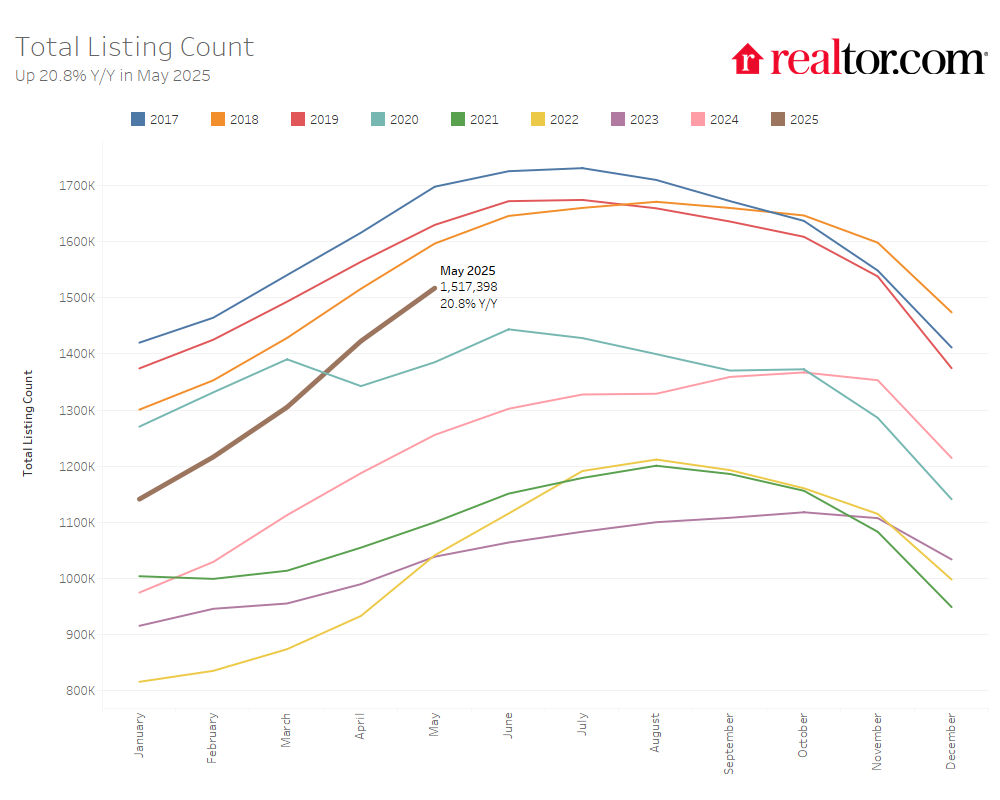
- The total number of unsold homes, including those under contract, was up 20.8% compared to last year.
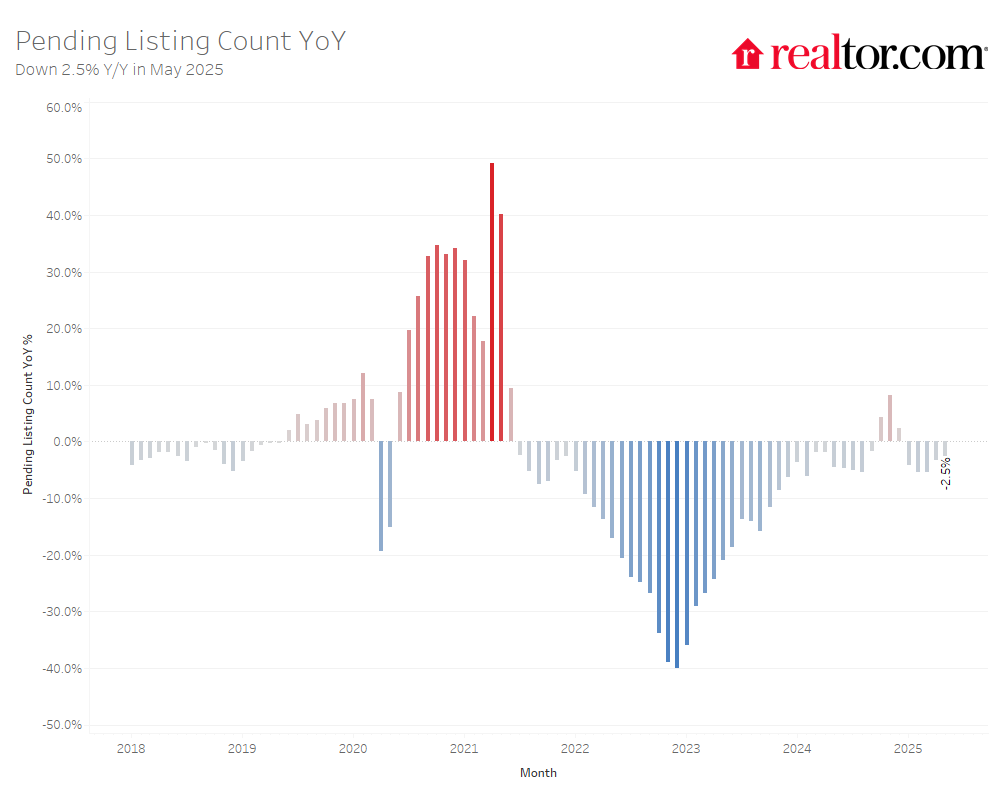
- Pending home sales- homes under contract- fell 2.5% compared to last year, as a renewed climb in mortgage rates weighed on buyers.
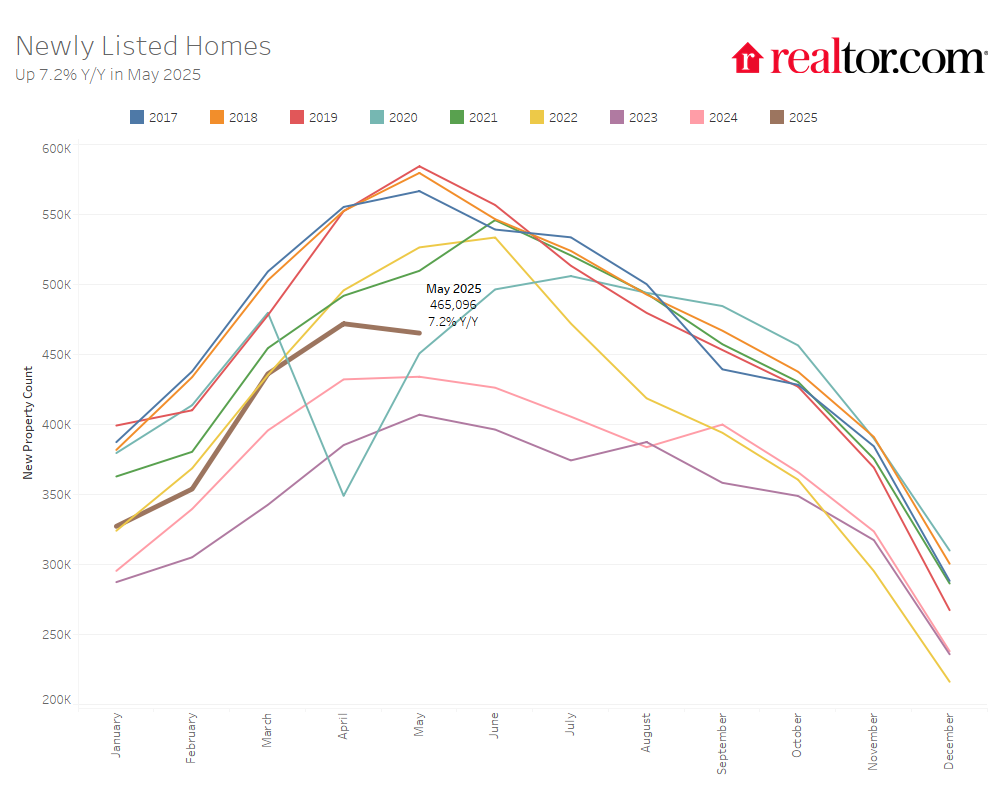
- Newly listed homes increased 7.2% from a year ago.
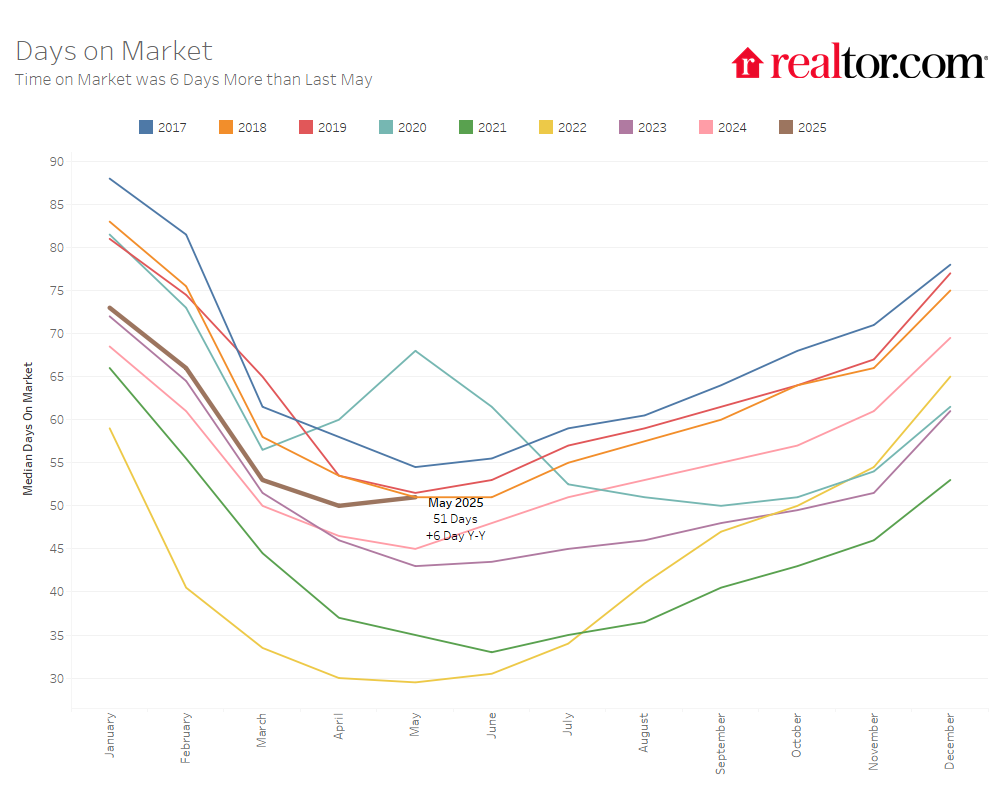
- Homes spent a median of 51 days on the market, six more than a year ago, but about the same level as pre-pandemic norms for May.
- The national median list price for homes was $440,000, about flat since last year, while the price per square foot rose 0.6%, consistent with very modest home value growth.
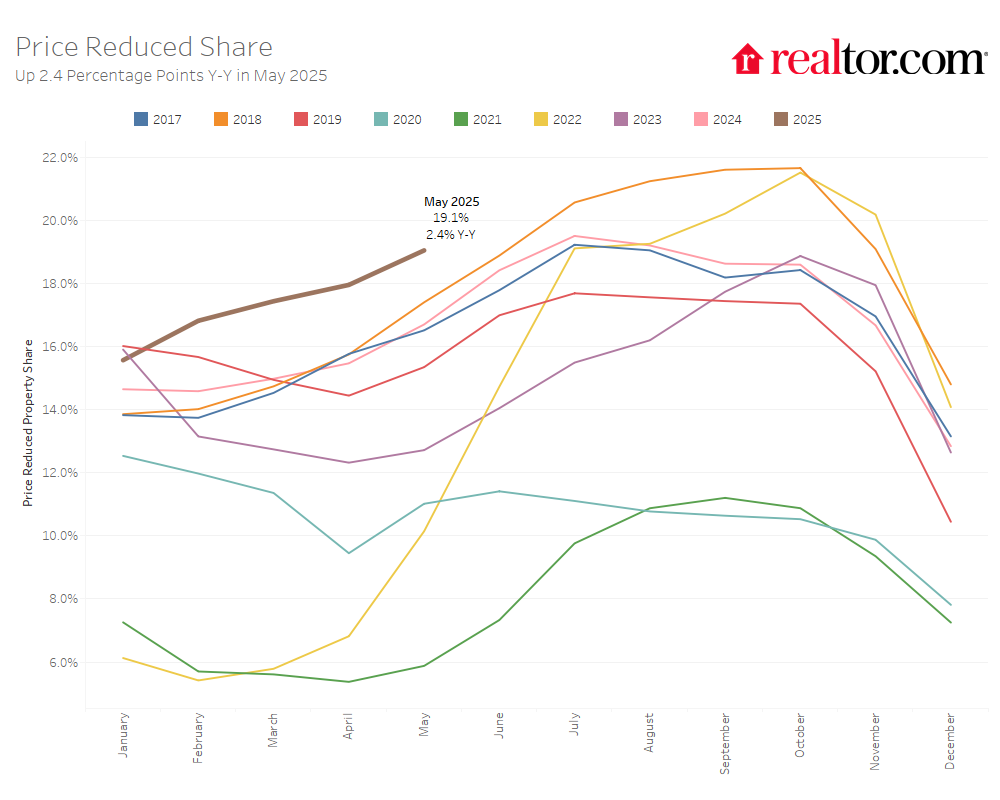
- Price cuts were reported on 19.1% of listings – the highest share for any May since at least July 2016 when our tracking began, and the fifth consecutive month with growing price reductions.
According to the Realtor.com® May housing data, the housing market offered buyers more options, as inventory continued to climb for the 19th straight month and new listings increased across every major region. Nationally, homes are taking almost a week longer to sell than a year ago. In some major metros, especially in the West, median time on market has now surpassed typical pre-pandemic levels. Prices meanwhile remained stable, but a growing share of sellers reduced their asking prices, reflecting mounting affordability pressures and underscoring the initial mismatch between sellers’ preferred prices and buyers’ willingness to pay. After edging down from late April to early May, mortgage rates increased from mid-May onward, and are pushing 7% yet again amid market uncertainty surrounding government trade, economic, and fiscal policies. Stubbornly high mortgage rates coupled with falling consumer sentiment is expected to weigh on buyer and seller activity during the spring buying season and beyond. While the income needed to purchase a home has leveled off nationally over the past year, it remains significantly higher than before the pandemic, underscoring the ongoing challenge of affordability even as market conditions gradually rebalance.
Homebuyers found more options in May, as the number of actively listed homes rose 31.5% compared to the same time last year. This builds on April’s 30.6% increase and marks the 19th consecutive month of year-over-year inventory gains. The number of homes for sale topped 1 million for the first time since Winter 2019 and exceeded 2020 levels for the second month in a row, a key pandemic recovery benchmark. Still, inventory remains 14.4% below typical 2017–2019 levels, though May’s gains indicate the market is closing the gap at an accelerating pace.
Total listing counts, which includes both homes for sale and those under contract, also posted a solid 20.8% year-over-year increase, maintaining its 18-month streak.
While inventory was up, buyer activity was more subdued. Pending home sales—listings under contract—fell 2.5% year-over-year, similar to April’s 2.6% drop.
Newly listed homes climbed 7.2% from last May. This was a modest decline from April’s 9.2% increase. Overall, new listings are tracking significantly higher than in 2023 and 2024, but still well below the pre-pandemic norm. New listings tend to ramp up in May, properly kicking off the Spring homebuying season. This year, however, listings declined slightly by 1.4% month-over-month perhaps hinting that this Spring may be slower to get off the mark than normal.
Where Housing Inventory Is Growing the Fastest
Inventory increased in all four major U.S. regions in May, though the pace varied:
- West: +40.7%
- South: +32.9%
- Midwest: +22.9%
- Northeast: +19.0%
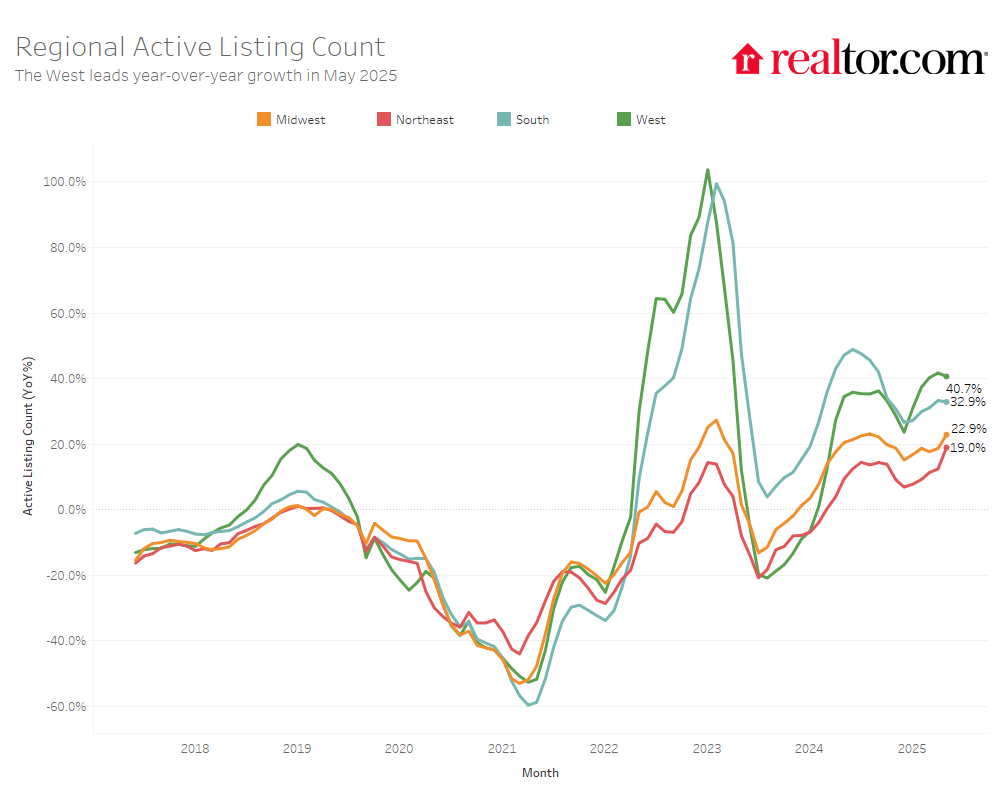
Compared to pre-pandemic norms, inventory in the West (+10.8%) and South (+3.6%) has recovered. But the Midwest (-41.0%) and Northeast (-52.4%) continue to lag significantly. These patterns echo regional construction trends: the South led the nation in new housing starts in 2024, while the Northeast had the widest housing supply gap, per Realtor.com’s latest Supply Gap Report.
At the metro level, all of the 50 largest markets recorded year-over-year inventory growth. The sharpest increases were seen in:
- Washington, D.C. (+75.6%)
- Las Vegas (+66.8%)
- San Diego (+66.4%)
A House Divided: The Stark Regional Divergence in Inventory Recovery
Despite widespread inventory gains on an annual basis, 28 of the 50 largest metros remain below pre-pandemic inventory levels. Even so, 22 markets have now exceeded their 2017–2019 norms, up from 20 last month and 18 in March.
There is a striking regional divergence on inventory recovery. Of the 22 metros whose inventory now exceeds their pre-pandemic norms, all are located in the South or West. In fact, current active inventory exceeds pre-pandemic norms in all but one major Southern metro, Birmingham, AL. On the west coast, only the three major Southern California markets of Los Angeles, San Diego, and Riverside have failed to reach their 2017-2019 inventory levels. The markets with greatest inventory relative to their pre-pandemic levels are:
- Denver (+100.0%)
- Austin (+69.0%)
- Seattle (+60.9%)
Inventory levels remain low throughout the Northeast and in parts of the Midwest. Despite year-over-year gains, the Washington, DC metro is still 15.9% below its 2017-2019 norms; and the New York metro is 44.0% below pre-pandemic levels.
The three metros that have recovered least are:
- Hartford (-77.7%)
- Chicago (-59.3%)
- Virginia Beach (-56.7%)
How New Construction Explains the Inventory Recovery, or Lack Thereof…
Why are some housing markets seeing a full inventory rebound while others remain stuck in pandemic-era lows? One major factor may be how much housing they’ve built.
Regions with little new construction since the pandemic, like New England and the Great Lakes, lag significantly behind their pre-pandemic inventory levels. Meanwhile, fast growing metros known for their pandemic era construction booms, like Austin and Denver, now have over 60% more active inventory than they did pre-2020.
The chart below compares each metro’s (gross) new construction since 2019 to its percent change in active listings in May 2025 relative to pre-pandemic norms. Here new construction is measured as total housing units completed since 2019 per 100 residents in 2019. For example, the Austin metro has built roughly 25 new housing units per 100 residents in 2019–well above the national average of 7 (the vertical line)–while New York has built just four.
There is a clear positive relationship here (the diagonal line, and an R2 of about 0.44 ): metros that built more have generally seen stronger inventory recoveries. Nearly every metro with above-average construction has returned to, or exceeded, pre-pandemic inventory levels. This includes the usual Sun Belt suspects and pandemic boomtowns like Austin, Nashville, and Denver where homes are now sitting on the market longer than before the pandemic and prices have leveled off.
Conversely, most markets that did not build much – despite high house price growth during the pandemic – have not seen inventories recover. That tends to be true whether they’re expensive metros like New York or Boston or more affordable markets like Baltimore or Buffalo. Without new supply, tight markets get tighter – and prices keep rising.
Still there are some notable exceptions to the rule: despite limited construction, the San Francisco metro now has more active listings and longer time on market than before the pandemic; meanwhile, Richmond, VA – a market that built about as much as Denver– still has not seen inventory or time on market recover.
These outliers may be emblematic of a bigger story about the post-pandemic housing cycle: in a world of high interest rates and stretched affordability, the markets where people wanted to live prior to the pandemic may not be where they are choosing to buy now. More affordable metros like Richmond may still be absorbing buyers priced out of expensive metros like San Francisco – even if new supply alone is not enough to ease tight conditions just yet.
Seller Activity Picked Up in Most Metros
Newly listed homes increased almost uniformly across all four regions in May, led by:
- South: +10.2%
- West: +9.2%
- Midwest: +8.2%
- Northeast: +3.0%
Relative to pre-pandemic May months, the South is closest to full recovery, with new listings just 7.1% below historical norms. The Northeast continues to lag—down 37.0%—mirroring its persistent construction shortfall. Nationally, new listings are down 19.4% relative to their pre-pandemic norms.
Among the 50 largest metros, 47 saw a year-over-year increase in new listings. However, just four metros surpassed pre-pandemic norms for new listings: Houston, Austin, San Antonio, and Dallas– all potentially softening Southern markets to watch.
Metros with the strongest growth in newly listed homes over the past year included:
- Milwaukee (+28.4%)
- Charlotte (+20.5%)
- Boston (+18.1%)
In May, the typical home spent 51 days on the market, which is 6 days longer than the same time last year. This marks the 14th straight month of homes taking longer to sell on a year-over-year basis. Time on market is slowly normalizing, as a result. Homes are spending about 1 fewer day on the market than the May 2017-2019 average, down from 5 fewer days last month.
Regional and Metro Trends: Time on Market Ticks Up
All four regions saw year-over-year increases in time on market, reflecting broader cooling trends:
- South: +6 days
- West: +5 days
- Midwest: +3 days
- Northeast: +1 day
Relative to pre-pandemic norms, most regions are still seeing quicker sales:
- West: 5 days slower
- South: 2 days faster
- Midwest: 9 days faster
- Northeast: 13 days faster
Among the 50 largest U.S. metro areas, 47 saw homes linger longer than last year. This figure is up from 34 metros last month, an indication of a widespread softening in time on market and likely a key contributor to the widespread year-over-year increases in active inventory. The biggest slowdowns in time on market were seen in:
- Nashville (+19 days)
- Orlando (+13 days)
- Miami (+13 days)
- Columbus, OH (+11 days)
About half (24) of the top 50 markets are now seeing listings sit longer than their pre-pandemic averages, almost all of which are in the South and West – another indication of the geographic divergence in housing market conditions.
In May, the national median list price held at $440,000, about the same as this time last year (+0.1%). Price per square foot—a gauge of home values that accounts for smaller homes entering the market—rose 0.6% year-over-year, again indicating modest price growth under the surface.
Since May 2019, the typical list price has climbed 37.5%, while price per square foot is up 53.3%. These long-term increases have significantly affected affordability.

Even though overall asking prices haven’t declined, more sellers are making price cuts. In May, 19.1% of home listings had price reductions—up 2.4 percentage points from last year. This is the highest May share in Realtor.com data going back to at least July 2016 when our tracking began.
Price reductions have become more common in each of the past five months, a trend suggesting that sellers are adjusting their expectations in the face of affordability challenges and weaker buyer demand in some markets. Regionally, price reductions in May were about twice as common in the South and West (21% of listings) as they were in the Northeast (11% of listings).
Regional Price Patterns: Flat or Falling in Most Areas
Year-over-year changes in median list prices by region were:
- Northeast: +0.1%
- South: -0.1%
- West: -0.7%
- Midwest: -1.6%
When adjusting for changing home sizes, price per square foot tells a more consistent story of growth—except in the South:
- Northeast: +3.1%
- West: +1.0%
- Midwest: +1.0%
- South: -0.3%
Among large metros, the biggest year-over-year median price increases were:
- Baltimore (+10.4%)
- Virginia Beach (+5.4)
- Cleveland (+3.8%)
The biggest year-over-year median price declines were:
- Austin (-6.3%)
- Cincinnati (-6.2%)
- Denver (-5.8%)
Metros with the most listings with price cuts, often linked to slower demand, included:
- Phoenix (31.3% of listings)
- Tampa (29.9%)
- Denver (29.4%)
May 2025 Regional Statistics
| Region | Active Listing Count YoY | New Listing Count YoY | Median Listing Price YoY | Median Listing Price Per SF YoY | Median Days on Market Y-Y (Days) | Price-Reduced Share Y-Y (Percentage Points) |
| Midwest | 22.9% | 8.2% | -1.6% | 1.0% | 3 | +1.9 pp |
| Northeast | 19.0% | 3.0% | 0.1% | 3.1% | 1 | +1.4 pp |
| South | 32.9% | 10.2% | -0.1% | -0.3% | 6 | +1.6 pp |
| West | 40.7% | 9.2% | -0.7% | 1.0% | 5 | +4.5 pp |
| National Average |
31.5% | 7.2% | 0.1% | 0.6% | 6 | +2.4 pp |
May 2025 Housing Overview of the 50 Largest Metros
| Metro | Active Listings | Median Listing Price Per Sq. Ft. | Median Days on Market | |||
| YoY | vs. Pre-pandemic | YoY | vs. Pre-pandemic | Y-Y | vs. Pre-pandemic | |
| Atlanta-Sandy Springs-Roswell, GA | 42.7% | 2.2% | -1.6% | 62.2% | 9 | 0 |
| Austin-Round Rock-San Marcos, TX | 26.5% | 69.0% | -5.0% | 56.3% | 3 | 3 |
| Baltimore-Columbia-Towson, MD | 48.7% | -44.1% | 4.5% | 28.6% | -2 | -11 |
| Birmingham, AL | 13.0% | -18.8% | 1.0% | 41.2% | 7 | -5 |
| Boston-Cambridge-Newton, MA-NH | 35.2% | -28.5% | 2.1% | 81.8% | 3 | -5 |
| Buffalo-Cheektowaga, NY | 11.0% | -42.5% | 6.3% | 69.2% | 5 | -1 |
| Charlotte-Concord-Gastonia, NC-SC | 56.4% | 7.0% | 0.7% | 67.9% | 10 | -2 |
| Chicago-Naperville-Elgin, IL-IN | 14.5% | -59.3% | -1.0% | 34.9% | 3 | -10 |
| Cincinnati, OH-KY-IN | 27.8% | -44.2% | 0.4% | 62.5% | 3 | -9 |
| Cleveland, OH | 24.5% | -51.5% | 5.2% | 44.4% | 4 | -16 |
| Columbus, OH | 45.1% | -4.0% | 0.7% | 64.9% | 11 | 2 |
| Dallas-Fort Worth-Arlington, TX | 44.8% | 55.5% | -1.2% | 45.7% | 7 | 5 |
| Denver-Aurora-Centennial, CO | 63.9% | 100.0% | -2.3% | 45.5% | 9 | 14 |
| Detroit-Warren-Dearborn, MI | 23.1% | -28.3% | 3.9% | 33.7% | 1 | 2 |
| Grand Rapids-Wyoming-Kentwood, MI | 30.0% | -29.7% | -0.4% | 60.9% | 4 | 1 |
| Hartford-West Hartford-East Hartford, CT | 15.5% | -77.7% | 4.5% | 66.0% | 8 | -17 |
| Houston-Pasadena-The Woodlands, TX | 35.3% | 18.6% | -0.6% | 40.8% | 3 | -2 |
| Indianapolis-Carmel-Greenwood, IN | 30.0% | -14.1% | -0.8% | 61.8% | 4 | -4 |
| Jacksonville, FL | 31.2% | 31.8% | -2.3% | 54.0% | 9 | 3 |
| Kansas City, MO-KS | 19.0% | -16.2% | -1.4% | 52.4% | 2 | 5 |
| Las Vegas-Henderson-North Las Vegas, NV | 66.8% | 28.6% | 0.3% | 64.8% | 7 | 5 |
| Los Angeles-Long Beach-Anaheim, CA | 53.9% | -2.5% | -1.1% | 55.8% | 10 | 10 |
| Louisville/Jefferson County, KY-IN | 22.4% | -26.1% | 1.8% | 55.5% | 5 | -5 |
| Memphis, TN-MS-AR | 26.2% | 22.3% | 1.7% | 75.8% | 10 | 8 |
| Miami-Fort Lauderdale-West Palm Beach, FL | 38.7% | 6.6% | -4.3% | 45.3% | 13 | -1 |
| Milwaukee-Waukesha, WI | 7.9% | -46.0% | 4.7% | 58.8% | 0 | -9 |
| Minneapolis-St. Paul-Bloomington, MN-WI | 14.1% | -20.2% | -1.8% | 37.1% | 4 | -2 |
| Nashville-Davidson–Murfreesboro–Franklin, TN | 40.0% | 44.4% | -2.7% | 66.3% | 19 | 17 |
| New York-Newark-Jersey City, NY-NJ | 10.7% | -44.0% | -5.3% | 84.1% | 2 | -4 |
| Oklahoma City, OK | 30.4% | -7.6% | 0.4% | 51.0% | 2 | -5 |
| Orlando-Kissimmee-Sanford, FL | 38.8% | 44.2% | -2.3% | 58.4% | 13 | 11 |
| Philadelphia-Camden-Wilmington, PA-NJ-DE-MD | 22.9% | -51.4% | 1.6% | 63.8% | -2 | -14 |
| Phoenix-Mesa-Chandler, AZ | 23.1% | 25.8% | -0.9% | 63.8% | -3 | 13 |
| Pittsburgh, PA | 20.2% | -41.3% | 0.9% | 41.8% | 1 | -17 |
| Portland-Vancouver-Hillsboro, OR-WA | 34.3% | 21.0% | -1.6% | 42.1% | 7 | 14 |
| Providence-Warwick, RI-MA | 34.0% | -56.2% | 5.4% | 58.9% | 9 | -12 |
| Raleigh-Cary, NC | 63.5% | 10.2% | -0.4% | 59.6% | 10 | -5 |
| Richmond, VA | 17.8% | -38.4% | 0.9% | 64.9% | -3 | -8 |
| Riverside-San Bernardino-Ontario, CA | 50.5% | -1.5% | -0.9% | 66.4% | 10 | 9 |
| Sacramento-Roseville-Folsom, CA | 54.6% | 4.9% | -2.5% | 41.3% | 8 | 6 |
| San Antonio-New Braunfels, TX | 20.1% | 58.3% | -3.0% | 40.7% | 7 | 8 |
| San Diego-Chula Vista-Carlsbad, CA | 66.4% | -5.1% | -2.1% | 65.8% | 10 | 9 |
| San Francisco-Oakland-Fremont, CA | 40.3% | 53.5% | -4.0% | 26.7% | 10 | 12 |
| San Jose-Sunnyvale-Santa Clara, CA | 55.7% | 33.1% | -1.1% | 30.0% | 8 | 5 |
| Seattle-Tacoma-Bellevue, WA | 50.7% | 60.9% | 4.7% | 72.4% | 6 | 11 |
| St. Louis, MO-IL | 19.4% | -42.4% | -1.8% | 36.9% | 7 | -11 |
| Tampa-St. Petersburg-Clearwater, FL | 31.2% | 45.3% | -2.4% | 68.9% | 8 | 7 |
| Tucson, AZ | 54.6% | 23.0% | -1.5% | 61.2% | 10 | 2 |
| Virginia Beach-Chesapeake-Norfolk, VA-NC | 26.8% | -56.7% | 4.9% | 57.6% | 6 | -11 |
| Washington-Arlington-Alexandria, DC-VA-MD-WV | 75.6% | -15.9% | -4.0% | 49.6% | 1 | -3 |
*Table 2: May 2025 Top 50 Metros by Price, New Listings, and Price Reduced Share
| Metro | Median Listing Price | Median Listing Price YoY | New Listing Count YoY | Price-Reduced Share | Price-Reduced Share Y-Y (Percentage Points) |
| Atlanta-Sandy Springs-Roswell, GA | $419,900 | -0.7% | 17.3% | 23.3% | 4.2 pp |
| Austin-Round Rock-San Marcos, TX | $525,000 | -6.3% | 13.2% | 29.2% | 0.9 pp |
| Baltimore-Columbia-Towson, MD | $399,999 | 10.4% | 6.6% | 15.3% | 2.3 pp |
| Birmingham, AL | $299,900 | 0.0% | -4.1% | 18.2% | 2.1 pp |
| Boston-Cambridge-Newton, MA-NH | $879,000 | -1.7% | 18.1% | 16.4% | 3.5 pp |
| Buffalo-Cheektowaga, NY | $299,900 | 0.8% | 4.6% | 7.0% | -0.2 pp |
| Charlotte-Concord-Gastonia, NC-SC | $450,000 | 3.4% | 20.5% | 23.6% | 4.2 pp |
| Chicago-Naperville-Elgin, IL-IN | $379,900 | -3.8% | 5.6% | 11.5% | 1.3 pp |
| Cincinnati, OH-KY-IN | $354,975 | -6.2% | 8.7% | 14.6% | 2.4 pp |
| Cleveland, OH | $275,000 | 3.8% | 5.7% | 14.2% | 3.2 pp |
| Columbus, OH | $389,900 | -2.5% | 5.0% | 21.1% | 4.4 pp |
| Dallas-Fort Worth-Arlington, TX | $440,000 | -3.2% | 12.1% | 27.0% | 3.5 pp |
| Denver-Aurora-Centennial, CO | $600,000 | -5.8% | 4.3% | 29.4% | 4.7 pp |
| Detroit-Warren-Dearborn, MI | $270,000 | 3.1% | 8.0% | 13.7% | 3.2 pp |
| Grand Rapids-Wyoming-Kentwood, MI | $399,900 | -3.1% | 15.9% | 13.5% | 1.8 pp |
| Hartford-West Hartford-East Hartford, CT | $469,450 | 3.2% | 2.4% | 6.8% | 0.9 pp |
| Houston-Pasadena-The Woodlands, TX | $372,500 | 0.7% | 17.0% | 19.9% | 1.7 pp |
| Indianapolis-Carmel-Greenwood, IN | $331,500 | -5.3% | 11.6% | 21.3% | 1.4 pp |
| Jacksonville, FL | $405,000 | -4.0% | 0.8% | 28.8% | 1.4 pp |
| Kansas City, MO-KS | $410,073 | -4.1% | 15.7% | 14.3% | 2.1 pp |
| Las Vegas-Henderson-North Las Vegas, NV | $484,999 | 1.7% | 17.3% | 25.4% | 8.3 pp |
| Los Angeles-Long Beach-Anaheim, CA | $1,195,000 | -2.3% | 6.3% | 15.7% | 4.7 pp |
| Louisville/Jefferson County, KY-IN | $326,990 | -0.6% | 0.3% | 16.6% | 1.4 pp |
| Memphis, TN-MS-AR | $350,000 | 0.5% | 1.9% | 21.9% | 0.2 pp |
| Miami-Fort Lauderdale-West Palm Beach, FL | $510,000 | -5.5% | 0.2% | 19.7% | 0.7 pp |
| Milwaukee-Waukesha, WI | $399,500 | -0.1% | 28.4% | 10.7% | 3.1 pp |
| Minneapolis-St. Paul-Bloomington, MN-WI | $446,000 | -2.5% | 4.1% | 12.9% | 1.1 pp |
| Nashville-Davidson–Murfreesboro–Franklin, TN | $548,950 | -5.7% | 15.2% | 20.9% | 0.1 pp |
| New York-Newark-Jersey City, NY-NJ | $795,000 | 0.2% | 6.4% | 8.7% | 0.4 pp |
| Oklahoma City, OK | $329,875 | -0.8% | 8.9% | 20.8% | 2.0 pp |
| Orlando-Kissimmee-Sanford, FL | $429,900 | -2.3% | -2.0% | 25.3% | 3.3 pp |
| Philadelphia-Camden-Wilmington, PA-NJ-DE-MD | $385,000 | 1.3% | 3.8% | 14.2% | 2.4 pp |
| Phoenix-Mesa-Chandler, AZ | $525,000 | -3.2% | 3.8% | 31.3% | 7.2 pp |
| Pittsburgh, PA | $249,900 | -2.9% | -1.2% | 15.8% | 1.7 pp |
| Portland-Vancouver-Hillsboro, OR-WA | $610,707 | -1.5% | 9.7% | 26.8% | 7.2 pp |
| Providence-Warwick, RI-MA | $595,000 | 3.1% | 0.8% | 10.5% | 3.1 pp |
| Raleigh-Cary, NC | $456,695 | -1.5% | 11.2% | 23.4% | 8.2 pp |
| Richmond, VA | $460,000 | -1.1% | 6.5% | 12.5% | 2.6 pp |
| Riverside-San Bernardino-Ontario, CA | $600,000 | -2.9% | 4.4% | 19.7% | 4.5 pp |
| Sacramento-Roseville-Folsom, CA | $639,000 | -3.6% | 13.7% | 22.7% | 6.2 pp |
| San Antonio-New Braunfels, TX | $340,000 | -1.4% | 4.4% | 24.9% | -1.3 pp |
| San Diego-Chula Vista-Carlsbad, CA | $995,000 | -5.7% | 6.4% | 19.9% | 5.4 pp |
| San Francisco-Oakland-Fremont, CA | $998,800 | -4.5% | 2.9% | 15.3% | 3.8 pp |
| San Jose-Sunnyvale-Santa Clara, CA | $1,419,500 | -3.9% | -0.3% | 13.5% | 5.0 pp |
| Seattle-Tacoma-Bellevue, WA | $799,000 | 3.1% | 18.0% | 16.2% | 4.8 pp |
| St. Louis, MO-IL | $299,900 | -2.5% | 6.3% | 14.3% | 2.2 pp |
| Tampa-St. Petersburg-Clearwater, FL | $417,500 | -1.6% | 0.1% | 29.9% | 1.0 pp |
| Tucson, AZ | $398,000 | -1.1% | -4.9% | 23.2% | 1.7 pp |
| Virginia Beach-Chesapeake-Norfolk, VA-NC | $415,000 | 5.4% | 10.4% | 17.5% | 0.5 pp |
| Washington-Arlington-Ale |