

In recent weeks, the price of Bitcoin has been facing intense volatility as sellers dominate the price chart. As a result, a growing number of analysts have compared Bitcoin’s current price action to the 2022 bear market. However, the comparison is based largely on short-term chart similarities. But a closer look at the larger data shows that this approach is deeply wrong, as revealed by a top analyst.
Bitcoin in 2022 Vs Bitcoin in 2026
A side-by-side comparison of Bitcoin’s 2022 bear market and the current market sentiment highlights just how much has changed in Bitcoin from macro conditions to volatility behavior. While prices may sometimes move in familiar patterns, the market below Bitcoin today is structurally different from what existed four years ago.
According to a prominent analyst Garrett, the most important difference is the macro backdrop. In 2022, the global economy was strongly inside a tightening cycle. Inflation surged due to excess COVID-era liquidity and was intensified by the war in Ukraine.
Central banks responded with aggressive interest rate hikes and balance sheet tightening. Liquidity was being drained from financial markets, and capital was focused on risk avoidance. Bitcoin, like other risk assets, experienced extended distribution under those conditions.
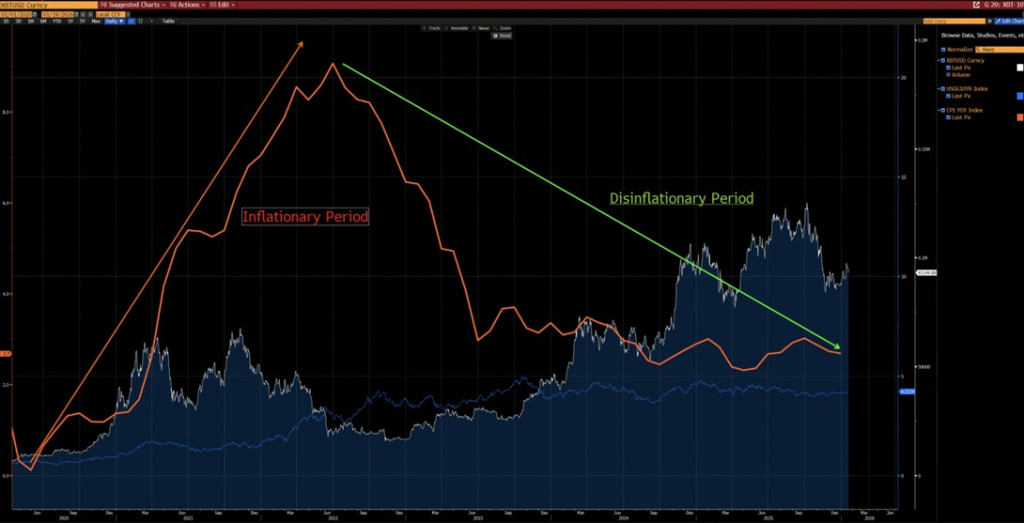
However, he pointed out that the situation is largely reversed today. Inflation has eased, U.S. risk-free rates are declining, and central banks are gradually re-injecting liquidity. Since 2020, Bitcoin has usually struggled when inflation was rising and performed better when inflation was cooling. It has also moved closely with overall U.S. liquidity, when money conditions loosen, Bitcoin tends to benefit.
Also read: Crypto Markets Drop—Bitcoin And Altcoins Drop After Tariff Shock Sparks Risk-Off Mood
Although heavy ETF inflows in 2024 temporarily blurred this relationship, recent liquidity data now shows a clear change. Liquidity data now shows that financial conditions are improving, not tightening. The main indicators have turned upward and moved above both their short-term and long-term downward trends, which suggests a new upward phase rather than a repeat of the restrictive environment seen in 2022.
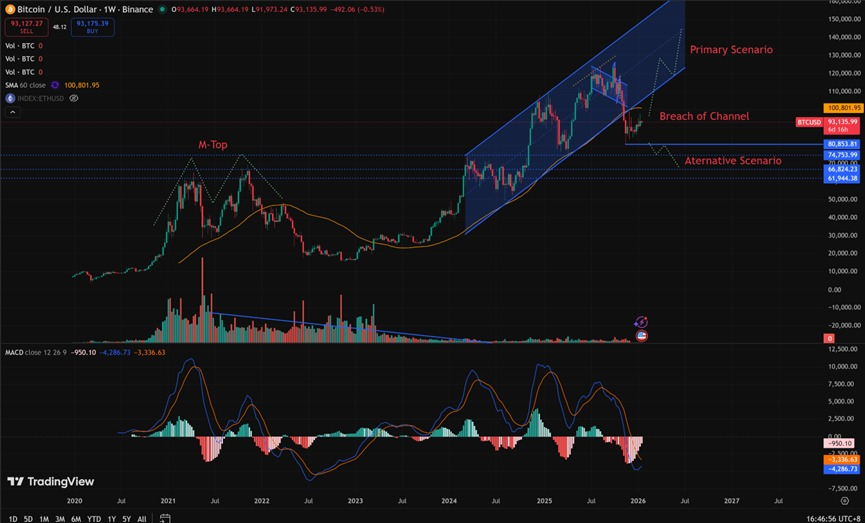
Garrett points out that the current price setup is very different from what we saw in 2021 and 2022. Back then, Bitcoin formed a long-term top, a pattern that usually signals a long period of falling or weak prices. This time, the recent drop looks more like a move below an upward trend, which often ends up being a short-term shakeout rather than the start of a deep bear market.
Just as importantly, Bitcoin spent a long stretch trading between roughly $62,000 and $80,850. That range allowed nervous sellers to exit while more confident buyers stepped in, leaving the market in a stronger position with more upside potential and less downside risk than in early 2022.
BTC Investor Sentiment Changed This Time
Garrett noted that the sentiment of Bitcoin investors has changed even more than the price patterns. In 2022, the market was mainly controlled by retail traders and crypto-focused players, many of whom were using high leverage.
When prices fell, panic selling and forced liquidations made the drop much worse, especially as exchange liquidity dried up. Today, large institutions are far more involved. Spot Bitcoin ETFs, corporate treasuries, pension funds, and even sovereign-style investors