

Highlights
December 2025 Luxury Trends
- National luxury prices stabilized, with the 90th-percentile threshold easing to $1.19 million (-0.6% YoY) after steeper declines earlier in the fall.
- Price softness persisted at the top: 8 of the 10 most expensive luxury markets still posted annual declines, though several saw smaller drops than last month.
- Luxury homes took longer to sell nationally, with the 90th-percentile segment slowing to a median of 88 days, reflecting seasonal cooling and a more selective buyer pool.
- Luxury price gaps vary widely by market, ranging from roughly 2× to more than 5× the local median, compared with a national benchmark of about 3×
- Miami’s luxury market continues to deepen, with strong in-migration helping push its million-dollar inventory past New York’s by year-end.
National Overview
| Pricing | December 2025 | Monthly Change | YoY Change |
| Luxury Threshold 90th Percentile | $1,192,866 | -0.6% | -0.6% |
| High-End Luxury Threshold 95th Percentile | $1,903,974 | -1.4% | -3.0% |
| Ultra Luxury Threshold 99th Percentile | $5,531,567 | 0.8% | -4.1% |
| Million-Dollar Listing Share | 12.0% | -0.8pp | -0.3pp |
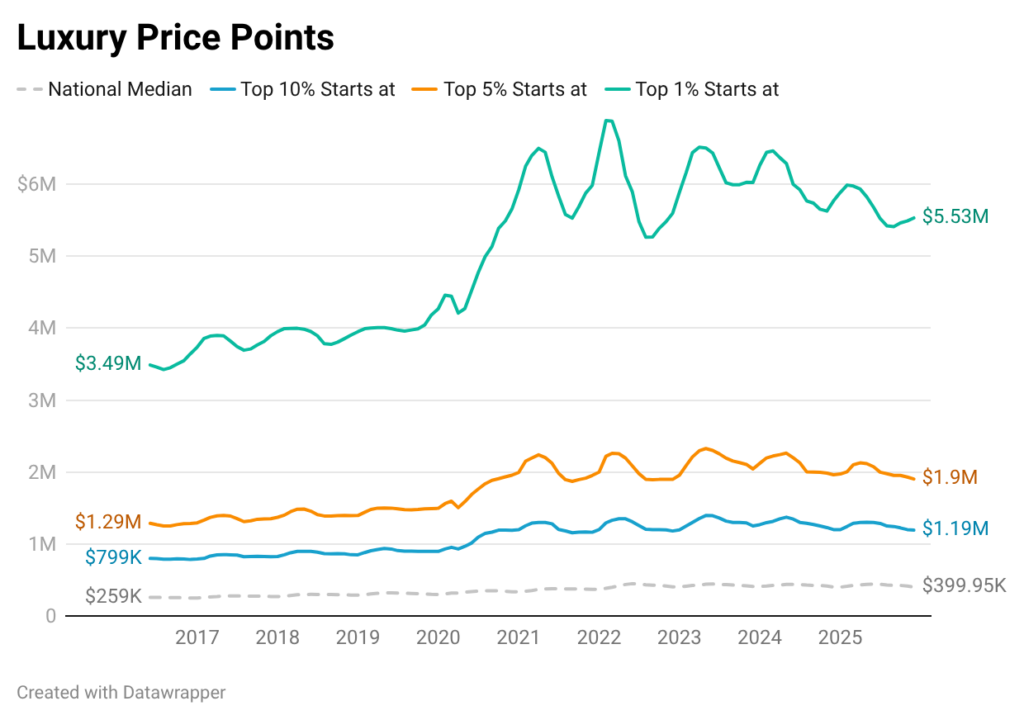
The national benchmark for luxury homes was little changed in December, easing 0.6% in December. The pace of decline is slowing, hinting that broad luxury pricing may be approaching a near-term floor.
Higher tiers remained under more pressure. The 95th-percentile threshold fell 3.0% from a year ago, while the ultra-luxury segment remained the most volatile, posting a modest monthly gain but sitting more than 4% below last December. Together, these trends point to continued recalibration at the very top of the market, even as entry-level luxury stabilizes.
Meanwhile, the share of million-dollar listings declined to 12.0%, reflecting both softer pricing and seasonal inventory dynamics rather than a sudden pullback in high-end supply.
Luxury homes took longer to sell across all tiers in December, consistent with normal year-end seasonality and reduced buyer urgency. Even so, the top of the market is not uniformly weakening: the 95th- and 99th-percentile segments still sold slightly faster than a year ago, suggesting that high-end and ultraluxury are finding buyers, however, this is a much smaller segment of the overall market and is susceptible to more volatility.
Top 10 Markets By 90th Percentile Listing Price
| Rank | Area | Metro/Micro | 10% Most Expensive Listings Start at: | 10% Most Expensive YoY | Average Annual Million-Dollar Listings Count | Multiple to Local Median Listing Price |
| 1 | Heber, UT | Micro | $6,945,000 | 5.8% | 867 | 4.6 |
| 2 | Key West-Key Largo, FL | Micro | $4,996,500 | -3.1% | 834 | 3.8 |
| 3 | Los Angeles-Long Beach-Anaheim, CA | Metro | $4,059,710 | -6.2% | 9,266 | 3.8 |
| 4 | Bridgeport-Stamford-Danbury, CT | Metro | $3,995,000 | -11.2% | 541 | 5.4 |
| 5 | Kahului-Wailuku, HI | Metro | $3,857,250 | -17.1% | 704 | 3.7 |
| 6 | Santa Rosa-Petaluma, CA | Metro | $3,700,000 | -5.6% | 506 | 3.7 |
| 7 | Naples-Marco Island, FL | Metro | $3,612,231 | -2.3% | 2,461 | 5.0 |
| 8 | San Jose-Sunnyvale-Santa Clara, CA | Metro | $3,498,000 | -7.4% | 1,026 | 2.9 |
| 9 | New York-Newark-Jersey City, NY-NJ | Metro | $2,999,603 | -9.0% | 11,619 | 4.0 |
| 10 | Oxnard-Thousand Oaks-Ventura, CA | Metro | $2,985,000 | -14.7% | 663 | 3.2 |
(Among metropolitan and micropolitan areas that averaged at least 500 million-dollar listings over the 12 months through December 2025)
Price Changes & Market Dynamics
December’s top-10 results reinforced a familiar pattern: luxury prices remain under pressure in most of the nation’s most expensive markets, but the magnitude of declines is becoming less uniform. Kahului-Wailuku again posted the steepest annual drop, though its decline narrowed compared with earlier in the fall.
Heber, UT, stood apart as both the most expensive luxury market and one of the few still posting annual gains, underscoring how sustained high-end demand and structurally constrained alternatives in legacy mountain markets have insulated this destination from broader pricing corrections.
Across California, luxury prices continued to reset, with Los Angeles, San Jose, Santa Rosa, and Oxnard all posting mid- to high-single-digit declines. These adjustments suggest recalibration rather than distress, particularly given that California markets still dominate the upper tier of national luxury pricing.
Overall, December’s data points to a luxury market that is cooling but not collapsing. Price discovery remains active, selling timelines have lengthened, and regional differences are becoming more pronounced, setting the stage for a more fragmented luxury landscape as 2026 begins.
One of the most notable shifts for million-dollar homes has been the recent crossover between New York-Newark-Jersey City, NY-NJ and Miami-Fort Lauderdale-West Palm Beach, FL in the number of million-dollar listings. The Miami metro now has the most million-dollar listings in the country. However, for much of the past decade, New York consistently held a substantially larger inventory of $1 million-plus homes. That gap has narrowed steadily. By early 2025, Miami briefly surpassed New York in active million-dollar listings, and by the end of 2025, it has edged ahead.
Both markets experienced a sharp contraction in luxury inventory following the initial pandemic impacts. New York’s pullback reflected a combination of reduced new listings, normalization after the 2020-2021 urban exodus, and a slower pace of luxury re-listing. Miami also saw a decline, but its recovery was more steady with fewer seasonal variances.
Seasonality further differentiates the two metros. New York’s luxury inventory follows a more traditional cycle, with spring and early summer build-ups followed by sharper late-year drawdowns.
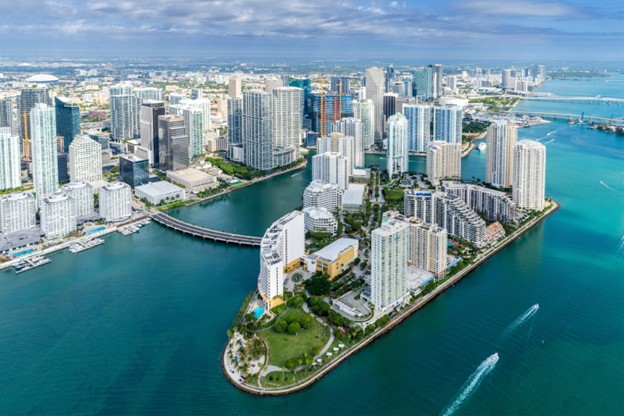
(Miami, FL)
Miami’s pattern is flatter and increasingly counter-cyclical, a dynamic shaped in part by differences in buyer composition. Luxury buyers in Miami are more likely to use cash and include a higher share of international purchasers, retirees, and second-home buyers, groups that are less constrained by mortgage rates or the school calendar, a major driver of seasonality in many housing markets. Out-of-town luxury buyers are also more likely to be present in Miami during the winter months rather than the summer, reinforcing listing activity at a time when many other markets, including New York, typically see inventory drawdowns. As a result, luxury listings in Miami tend to rebuild more quickly after seasonal dips and maintain higher baseline inventory levels year-round.
Taken together, the crossover does not signal weakness in New York’s luxury market, but rather a structural shift in where luxury inventory is accumulating. Miami’s trajectory points to a deeper and more persistent luxury supply base, while New York’s reflects a mature market where high-end inventory remains sizable but more tightly managed and slower to expand.
That divergence is reinforced by buyer migration patterns. More than one-quarter of demand in the Miami metro, 26.3%, originates from the New York metro, a share larger than the combined contribution of the next eight source metros.
Luxury Markets With the Widest Gaps Between Median and Luxury Prices
Some housing markets exhibit a wide divide between the typical home and the entry point to luxury. In these metros, luxury pricing is not a slight step up from the median, it represents a fundamentally different tier of housing altogether. These gaps often reflect sharp differences across neighborhoods, where luxury demand is concentrated into narrow pockets that can change rapidly from one ZIP code to the next.
Nationally, the 10% most expensive homes start at roughly three times the median listing price, setting a baseline for what constitutes luxury across the U.S. But in several markets, that multiple stretches far higher, underscoring how uneven some local housing landscapes are.
Where the Luxury Gap Is Largest
| Rank | Area | 10% Most Expensive Listings Start at: | Multiple to Local Median Listing Price | Multiple to National Median Listing Price | Median Days on Market 10% Most Expensive |
| 0 | USA | $1,192,866 | 3.0 | 3.0 | 88 |
| 1 | Bridgeport-Stamford-Danbury, CT | $3,995,000 | 5.4 | 10.0 | 89 |
| 2 | Naples-Marco Island, FL | $3,612,231 | 5.0 | 9.0 | 66 |
| 3 | Miami-Fort Lauderdale-West Palm Beach, FL | $2,437,028 | 4.9 | 6.1 | 93 |
| 4 | Crestview-Fort Walton Beach-Destin, FL | $2,837,322 | 4.9 | 7.1 | 117 |
| 6 | Heber, UT | $6,945,000 | 4.6 | 17.4 | 133 |
| 5 | Atlantic City-Hammonton, NJ | $2,372,550 | 4.5 | 5.9 | 93 |
| 8 | Charleston-North Charleston, SC | $1,959,417 | 4.0 | 4.9 | 86 |
| 9 | New York-Newark-Jersey City, NY-NJ | $2,999,603 | 4.0 | 7.5 | 100 |
| 7 | North Port-Bradenton-Sarasota, FL | $1,869,281 | 3.9 | 4.7 | 75 |
| 10 Tie | Key West-Key Largo, FL | $4,996,500 | 3.8 | 12.5 | 68 |
| 10 Tie | Los Angeles-Long Beach-Anaheim, CA | $4,059,710 | 3.8 | 10.2 | 91 |
The Bridgeport-Stamford-Danbury, CT metro tops the list, with luxury homes priced at 5.4 times the local median and 10 times the national median. This gap reflects the region’s bifurcated market structure, where ultra-high-end coastal and commuter enclaves coexist alongside more typical inland housing. Despite the steep pricing divide, luxury homes here are not stagnant, selling in a median of 89 days, close to the national luxury pace of 88 days suggesting healthy demand despite the premium price.

(Ultraluxury listing Greenwich, CT)
ZIP level data showcase diversity in close proximity. The Greenwich 06831 ZIP in the Bridgeport-Stamford-Danbury, CT metro has a median listing price of $4.87 million, this is about a 6 mile drive from Stamford, CT, where the 06902 ZIP has a median listing price of $470,613.
In Naples-Marco Island, FL, ranked second, the luxury threshold sits at five times the local median, reinforcing how dominant high-end housing is within the market. Unlike many wide-gap metros, Naples’ luxury homes continue to move relatively quickly, with a median of 66 days on market, signaling sustained demand even as broader conditions normalize.
The Miami-Fort Lauderdale-West Palm Beach, FL metro also shows a pronounced divide, placing it third. Luxury entry prices are nearly five times the local median, reflecting intense concentration of wealth in coastal and urban core neighborhoods. However, longer selling timelines, 93 days for the top 10%, suggest buyers are more selective at elevated price points. At the same time, the overall housing market in the Miami metro typically has longer days on markets, and sellers that are more willing to delist their homes instead of reducing prices.
Resort and Lifestyle Markets
Several lifestyle-oriented markets appear prominently on the list. Crestview-Fort Walton Beach-Destin, FL and Key West-Key Largo, FL both post large gaps between median and luxury prices. In these markets, luxury homes also take longer to sell, particularly in Crestview-Destin, where the median stretches to 117 days. A common thread across many of these metros is proximity to the coastline, where access to waterfronts, views, and limited developable land creates sharp price stratification within the same market. Lifestyle-driven demand in these areas tends to concentrate luxury housing into narrow corridors, widening the gap between typical homes and the top of the market.
Heber, UT stands apart. While its luxury threshold is “only” 4.6 times the local median, it is more than 17 times the national median, reflecting a market where both typical and luxury prices are elevated by national standards. The longer luxury selling time, 133 days, highlights how thin and specialized demand can be in high-priced micropolitan markets. Rather than coastline, Heber’s price stratification appears driven by mountain views, access to outdoor recreation, larger lot sizes, and privacy, amenities that function similarly to waterfronts in coastal markets.
What These Gaps Reveal
Large gaps between median and luxury prices are not necessarily signs of overheating or distress. Instead, they point to highly segmented markets, where luxury behaves almost independently from the broader housing stock. In these metros, small shifts in inventory, pricing strategy, or buyer composition can produce outsized changes at the top of the market without meaningfully affecting the median home.
Markets Where Luxury Is Closest to the Median
| Rank | Area | 10% Most Expensive Listings Start at: | Multiple to Local Median Listing Price | Multiple to National Median Listing Price | Median Days on Market 10% Most Expensive |
| 0 | USA | $1,192,866 | 3.0 | 3.0 | 88 |
| 1 | Orlando-Kissimmee-Sanford, FL | $889,260 | 2.1 | 2.2 | 93 |
| 2 | Riverside-San Bernardino-Ontario, CA | $1,278,288 | 2.2 | 3.2 | 71 |
| 3 | Charlotte-Concord-Gastonia, NC-SC | $922,626 | 2.2 | 2.3 | 82 |
| 4 | Portland-Vancouver-Hillsboro, OR-WA | $1,289,180 | 2.2 | 3.2 | 131 |
| 6 | Raleigh-Cary, NC | $983,406 | 2.2 | 2.5 | 92 |
| 5 | Atlanta-Sandy Springs-Roswell, GA | $899,663 | 2.2 | 2.2 | 79 |
| 8 | Houston-Pasadena-The Woodlands, TX | $789,558 | 2.3 | 2.0 | 71 |
| 9 | Denver-Aurora-Centennial, CO | $1,265,555 | 2.3 | 3.2 | 92 |
| 7 | Dallas-Fort Worth-Arlington, TX | $950,136 | 2.3 | 2.4 | 82 |
| 10 Tie | Boise City, ID | $1,384,063 | 2.3 | 3.5 | 80 |
| 10 Tie | San Antonio-New Braunfels, TX | $750,008 | 2.3 | 1.9 | 10 |