

- Inventory climbs but growth slows: Active listings rose 15.3% year over year, marking the 24th straight month of gains. However, the pace of growth has eased each month since May, signaling a plateau in the post-pandemic inventory recovery.
- Regional divide has begun to narrow slightly: Inventory growth in the South and West has slowed since spring, offsetting modest gains in the Northeast and Midwest and stalling the national recovery.
- Buyer activity remains soft despite lower mortgage rates: Even as rates have fallen to 12-month lows, homes are spending longer on the market for the 19th straight month (63 days, +5 year on year). Pending sales slipped 1.9% YoY.
- Prices hold steady nationally but fall in the South and West: The national median list price edged up 0.4% from a year ago to $424,200. The price per square foot dipped 0.5% year over year, with declines concentrated in the South and West and gains in the Northeast and Midwest.
- Shutdown weighs on buyer confidence and housing activity in federal metros: Early data shows dips in new listings and search activity in Washington, DC, Virginia Beach, Oklahoma City, and Baltimore—markets with the highest shares of federal employees. Broader price and inventory trends, however, remain largely unchanged for now.
In October, homebuyers saw more options as inventory grew for the 24th consecutive month, according to Realtor.com® housing data. The number of homes for sale remained above 1 million for the sixth month in a row, but the pace of growth continued its slowdown that began in mid-summer.
Despite falling mortgage interest rates over the past few months, the housing market’s pace remains slow. Homes spent longer on the market for the 19th straight month, with the slowdown most pronounced in Florida and the West. List prices nationally were flat year over year but slipped in the South and West, with regional differences starker when measured on a per-square-foot basis.
This month’s report also takes a closer look at how the federal government shutdown is playing out across local housing markets. Using new data on early signs from Realtor.com listings and search activity, we find that housing markets with the highest shares of federal employees—such as Washington, DC, Virginia Beach, Oklahoma City, and Baltimore—are showing early signs of a pause in some housing market activity. New listings and buyer searches have slowed the most in these metros as uncertainty around paychecks weighs on confidence, even as broader market trends remain largely unchanged.
Table of Contents:
- Inventory: Active Listings and Regional Breakdown
- Flows: New and Pending Listings
- Momentum: Time on the Market, List Prices, Price Reductions
- In Focus: Government Shutdown and Local Housing Markets
- Data Appendix
Homebuyers found more options in October, as the number of actively listed homes rose 15.3% compared to the same time last year. While this marks the 24th consecutive month of year-on-year inventory gains, active listing growth has slowed in each of the past five months (down from 17% in September, 20.9% in August, 24.8% in July, 28.9% in June, and 31.5% in May). The number of homes for sale topped 1 million for the sixth consecutive month, unchanged since July. Still, nationwide October inventory remains 13.2% below typical 2017–19 levels, about the same as last month, an indication that the nationwide inventory recovery has stalled.

Where housing inventory is growing the fastest
Inventory increased in all four major U.S. regions in October, but the pace of that growth has slowed recently.
- West: +17.4%
- South: +17%
- Midwest: +12.2%
- Northeast: +8.9%
At the metro level, all of the 50 largest markets recorded year-over-year inventory growth. These metros saw the sharpest increases:
- Washington, DC(+38.2%)
- Charlotte (+36.4%)
- Las Vegas (+35.1%)
Where housing inventory has recovered since the COVID-19 pandemic
Past reports and our “Cruel Summer” rundown have already mapped the striking regional divergence in inventory recovery and looked at the reasons behind it. For October, inventory in the West (+3.2%) and South (+4.6%) remains above pre-pandemic norms, while the Midwest (-35.7%) and Northeast (-48.6%) continue to lag significantly. At the national level, recovery vs. pre-pandemic has effectively stalled—largely driven by the relative slowdown in the West, where inventories this summer were as large as 11.4% above pre-pandemic norms
At the metro level, 10 of the top 50 metros now exceed their pre-pandemic inventories by 25% or more—all in the South or West.
These markets continue to have the greatest inventory relative to their pre-pandemic levels:
- Denver (+57%)
- San Antonio (+51.9%)
- Austin (+44.9%)
On the flip side, 17 of the top 50 metros still lag at least 25% below their pre-pandemic inventory norms.
These three metros have recovered the least:
- Hartford, CT (-74%)
- Chicago (-56.9%)
- Providence (-54.5%)
The figure below plots changes in inventory recovery relative to pre-pandemic norms between May and October 2025. Nationally, there has been little movement since May in terms of inventory recovery. This is driven by offsetting inventory trends at the low and high end. Relative to pre-pandemic levels, low-inventory metros at the top of the chart in the Northeast and Midwest have shown some modest growth. Meanwhile, metros toward the bottom of the chart (mostly in the West and South) have seen their inventory recoveries reverse back down toward pre-pandemic norms. The inventory recovery has receded in the West in particular, notably in Denver, Seattle, San Francisco, and San Jose.
Back to top
Newly listed homes grew 5.1% year over year, and were down 2.7% month over month, roughly in line with seasonal trends. New listings in October were 19% below their 2025 peak from April, but the pace of the decline has slowed since August.
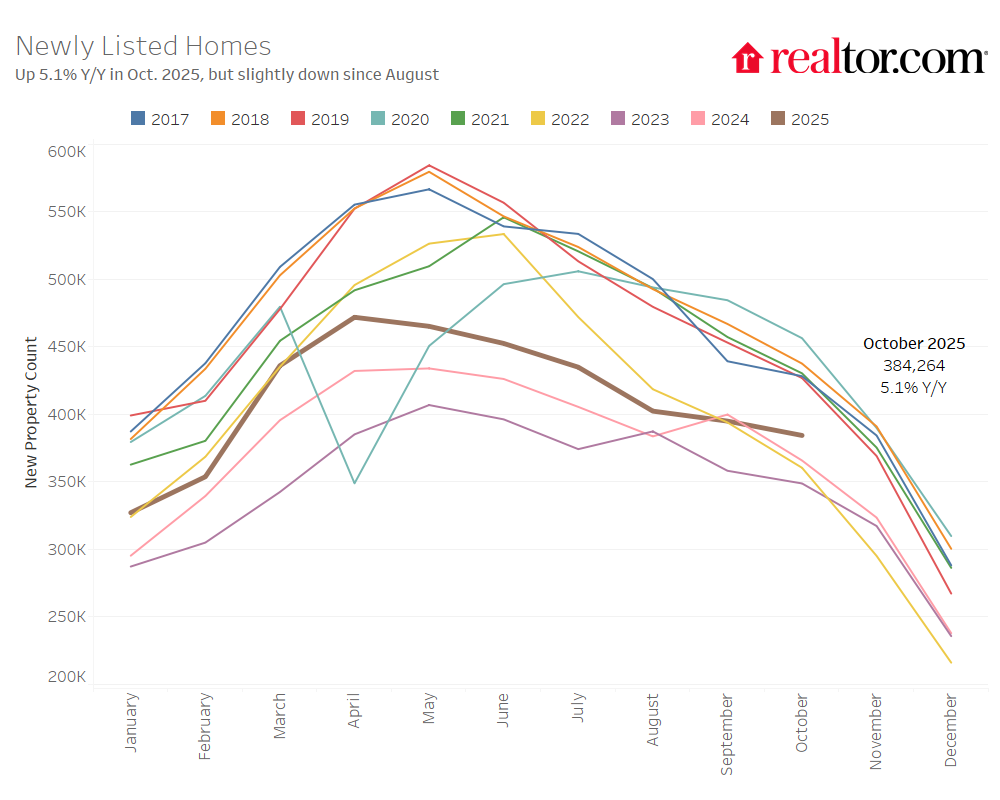
On an annual basis, newly listed homes increased in all four regions:
- Northeast: +3.3%
- Midwest: +4.8%
- South: +5.2%
- West: +4.2%
While inventory was up, buyer activity was more subdued. Pending home sales—listings under contract—fell by 1.9% year over year, returning to negative territory after a flat reading in September.
In October, the typical home spent 63 days on the market, which is 5 days longer than the same time last year. This marks the 19th straight month of homes taking longer to sell on a year-over-year basis. However, the gap has shrunk, falling below the one-week mark for the first time since June. With a median of 63 days, homes are now selling 3 days faster than their October 2017–19 norms after pacing in line with pre-pandemic norms in July through September. In short, time on the market has returned to more historically normal levels, although inventory still lags.

Regional and metro trends: Time on the market keeps on ticking
All four regions saw year-over-year increases in time on the market, reflecting broader cooling trends:
- West: +8 days
- South: +5 days
- Midwest: +2 days
- Northeast: +2 days
Relative to pre-pandemic norms, only the West is seeing slower sales:
- West: 11 days slower
- South: 1 day faster
- Midwest: 14 days faster
- Northeast: 19 days faster
Among the 50 largest U.S. metro areas, just 3 saw homes move faster than last year: Providence, St. Louis, and Minneapolis. Longer time on the market remains a key contributor to the widespread year-over-year increases in active inventory. These metros saw the biggest slowdowns in time on the market:
- Miami (+13 days)
- Orlando (+12 days)
- Denver (+11 days)
Now, 21 of the top 50 markets are seeing listings sit longer than their pre-pandemic averages, almost all of which are in the South and West—another indication of the geographic divergence in housing market conditions.
List prices remain flat nationally, but fall slightly in the South and West
In October, the national median list price was $424,200, up 0.4% from last year and down a touch (-0.2%) since last month. The price per square foot—a gauge of home values that accounts for the size of homes on the market—fell slightly (down 0.5% YoY and -0.8% MoM).
Since October 2019, the typical list price has climbed 36.9%, while the price per square foot is up 49.8%. These long-term increases have significantly affected affordability even before the impact of higher mortgage rates is considered. Most of these increases are a holdover from gains during the COVID-19 pandemic era. Since October 2022, the national median list price is down 0.2%, while the price per square foot is up 3%—despite a 46.1% increase in inventory and the median home staying on the market for 13 days longer.

Regional list price patterns: Overall vs. per square foot
Year-over-year changes in median list prices by region:
- Northeast: 0%
- Midwest: +0.8%
- South: -0.9%
- West: -2.6%
When adjusting for changing home sizes, the price per square foot tells a story of more pronounced regional differences, with prices rising more robustly in the Northeast:
- Northeast: +3.8%
- Midwest: +1.1%
- South: -1.4%
- West: -1.6%
Price cuts remain elevated
Turning back to the national picture, price cuts continue to be a key feature of the 2025 market, even as median list prices edged up slightly. In October, 20.2% of home listings had price reductions—up a modest 1.6 percentage points from last year, and up slightly since last month.
Price reductions in October have begun to show some more uniformity by region (around the national average), though the Northeast is an exception with price cuts on less than 15% of listings. The Northeast continues to distance itself from the Midwest and other regions this month, especially on key metrics like price changes, new listing growth, and price reductions. More limited new construction in the Northeast is likely a factor.
- Northeast: 14.5% of listings
- Midwest: 20.2%
- South: 21.3%
- West: 21.5%
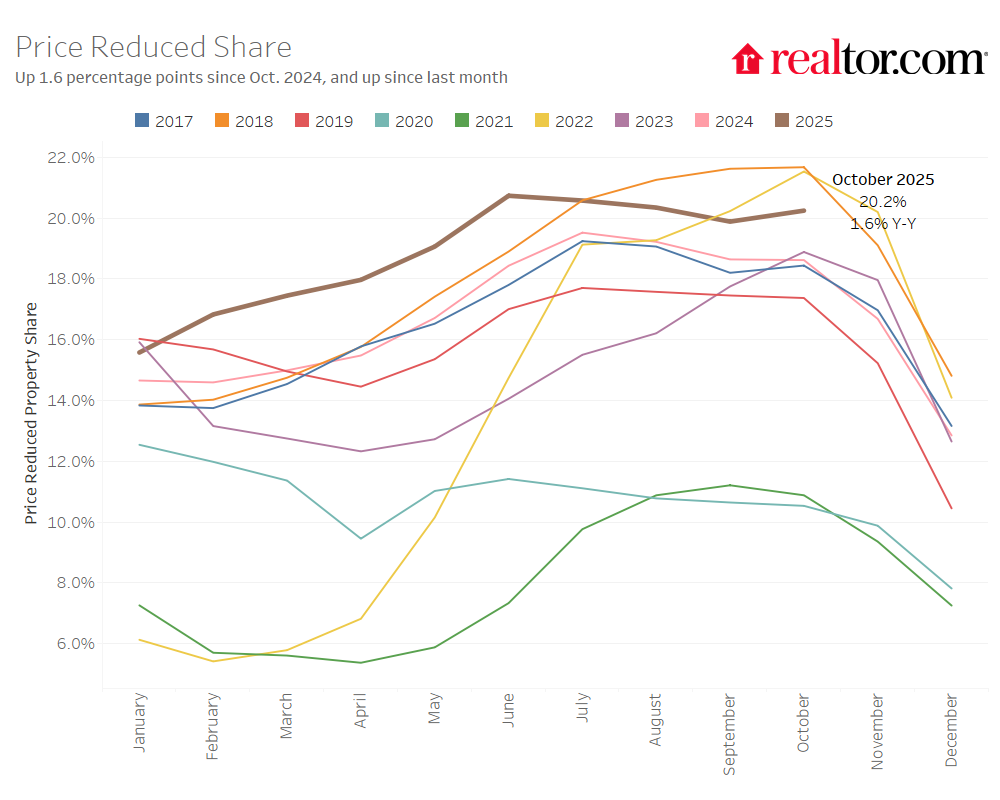
These metros saw the most listings with price cuts, often linked to slower demand:
- Denver (31.3% of listings)
- Portland (31.1%)
- Indianapolis (30.9%)
Back to top
Using new data on where federal workers live and early signs from Realtor.com listings and search activity, we find that housing markets with the highest shares of federal employees—such as Washington, DC, Virginia Beach, and Baltimore—are showing early signs of a pause in housing activity. New listings and buyer searches have slowed in these metros as uncertainty around paychecks weighs on confidence, even as broader market trends remain largely unchanged.
The federal government shutdown that began on Oct. 1 and continues as of this writing has halted many public services and created uncertainty for hundreds of thousands of federal employees. Much has already been written about how the shutdown could affect the housing market—from delayed mortgage processing and halted flood insurance renewals to paused economic data releases that shape mortgage rate expectations.
This month’s special angle looks at the geography of the shutdown by analyzing how local housing markets with larger shares of federal workers are feeling the impact. Using Bureau of Labor Statistics data across the top 50 metros, we identify markets that are most exposed, then use Realtor.com data to track how housing activity has shifted since the shutdown began. To capture very recent shifts in listings, prices, and buyer interest before and after Oct. 1, we focus on month-over-month changes and compare key metros to their regional and national aggregates.
Here’s what we find:
(1) These housing markets are most directly exposed to federal employment:
- Washington, DC, metro (where 11% of the employed people are federal workers)
- Virginia Beach metro (7%)
- Oklahoma City metro (4.2%)
- Baltimore metro (3.7%).
(2) In these areas, we see a modest pullback in new listings, with the largest declines appearing in search activity, suggesting that potential buyers are hesitating to start or continue their home search while paychecks are uncertain. This is especially true when comparing trends in the three cities to trends in the South overall and the national average over this time.
(3) On the other hand, key metrics like median list prices, inventory levels, and time on the market have shown little movement or no clear departure from national and regional trends so far. For example, although median list prices per square foot fell month over month in DC, Virginia Beach, Oklahoma City, and Baltimore, these declines are in line with national and seasonal trends; local price stagnation is likely not due to the shutdown itself but rather broader housing market pressures.
| Geography | New Listings | Realtor.com Page Views Per Property | Active Listings | Pending Listings | Median List Price | Median List Price, Per Sq. Ft. | Median Days on Market |
| All Values Month-Over-Month Changes, From September to October 2025 | |||||||
| DC | -13.9% | -11.5% | 0.3% | 0.4% | -0.9% | -0.3% | 0 |
| VA Beach | -5.1% | -10.7% | -2.0% | -7.3% | -0.7% | -0.1% | 1 |
| Okla. City | -1.4% | -8.6% | 1.7% | -2.3% | -0.2% | -0.1% | 4 |
| Baltimore | -2.4% | -9.7% | 1.3% | -2.8% | -0.6% | -0.8% | 3 |
| Compare with: | |||||||
| South | 1.6% | -5.9% | 0.3% | -3.6% | -0.9% | -0.6% | 0 |
| National Avg. | -2.7% | -6.2% | 0.0% | -3.3% | -0.2% | -0.8% | 1 |
October 2025 Regional Statistics
| Region | Active Listing Count, YoY | New Listing Count, YoY | Median List Price | Median List Price, YoY | Median List Price Per SF, YoY | Median Days on Market, YoY (Days) | Price-Reduced Share | Price-Reduced Share, YoY (Percentage Points) |
| Northeast | 8.9% | 3.3% | $525,000 | 0.0% | 3.8% | 2 | 14.5% | 1.2 |
| Midwest | 12.2% | 4.8% | $315,000 | 0.8% | 1.1% | 2 | 20.2% | 2.1 |
| South | 17.0% | 5.2% | $385,000 | -0.9% | -1.4% | 5 | 21.3% | 1.7 |
| West | 17.4% | 4.2% | $599,450 | -2.6% | -1.6% | 8 | 21.5% | 1.6 |
| National Average | 15.3% | 5.1% | $424,200 | 0.4% | -0.5% | 5 | 20.2% | 1.6 |
October 2025 Housing Overview of the 50 Largest Metros
| Metro | Active Listing Count, YoY | New Listing Count, YoY | Median List Price | Median List Price, YoY | Median List Price Per SF, YoY | Median Days on Market, YoY (Days) | Price- Reduced Share | Price-Reduced Share, YoY (Percentage Points) |
| Atlanta-Sandy Springs-Roswell, GA | 16.6% | 0.1% | $415,000 | 0.9% | -0.9% | 8 | 24.0% | 1.4 |
| Austin-Round Rock-San Marcos, TX | 11.0% | 13.7% | $489,859 | -5.7% | -5.1% | 7 | 26.7% | 2.5 |
| Baltimore-Columbia-Towson, MD | 26.2% | -12.0% | $382,500 | 3.4% | 1.8% | 5 | 20.3% | 4.1 |
| Birmingham, AL | 11.9% | -6.0% | $299,900 | 0.7% | 0.7% | 1 | 20.0% | 3 |
| Boston-Cambridge-Newton, MA-NH | 19.0% | -0.5% | $799,900 | -4.5% | -0.3% | 3 | 22.6% | 4.6 |
| Buffalo-Cheektowaga, NY | 12.0% | 4.6% | $267,450 | -0.4% | 1.7% | 0 | 10.3% | -0.1 |
| Charlotte-Concord-Gastonia, NC-SC | 36.5% | 19.4% | $438,348 | 2.1% | -0.3% | 7 | 27.1% | 4.3 |
| Chicago-Naperville-Elgin, IL-IN | -1.8% | -4.8% | $364,900 | -1.4% | 0.0% | 1 | 17.0% | 1.2 |
| Cincinnati, OH-KY-IN | 16.7% | 6.9% | $339,950 | 3.0% | 2.4% | 1 | 22.9% | 2.4 |
| Cleveland, OH | 11.7% | 3.6% | $259,900 | 4.0% | 4.0% | 1 | 21.2% | 1.9 |
| Columbus, OH | 24.2% | 13.6% | $365,450 | -0.9% | -1.1% | 7 | 30.0% | 6.5 |
| Dallas-Fort Worth-Arlington, TX | 13.7% | -4.2% | $425,000 | -1.7% | -1.9% | 8 | 28.0% | 2.1 |
| Denver-Aurora-Centennial, CO | 17.0% | -5.5% | $594,500 | -1.6% | -3.2% | 11 | 31.3% | 0.9 |
| Detroit-Warren-Dearborn, MI | 21.1% | 9.2% | $268,000 | -1.2% | -0.6% | 2 | 20.2% | 2.9 |
| Grand Rapids-Wyoming-Kentwood, MI | -0.6% | 5.1% | $389,900 | 2.6% | 4.6% | 3 | 22.3% | 1.5 |
| Hartford-West Hartford-East Hartford, CT | 7.1% | -1.6% | $439,450 | 7.2% | -0.7% | 2 | 11.6% | 0 |
| Houston-Pasadena-The Woodlands, TX | 22.7% | 3.5% | $358,000 | -2.5% | -1.9% | 6 | 20.0% | 3.5 |
| Indianapolis-Carmel-Greenwood, IN | 24.7% | 10.0% | $320,000 | -0.6% | -0.3% | 4 | 31.1% | 3.7 |
| Jacksonville, FL | 2.8% | -13.1% | $388,950 | -2.2% | -3.1% | 6 | 26.4% | 0.5 |
| Kansas City, MO-KS | 21.4% | 2.2% | $380,000 | 0.8% | 1.0% | 0 | 21.2% | 3.2 |
| Las Vegas-Henderson-North Las Vegas, NV | 35.1% | 6.3% | $471,975 | -0.6% | -1.5% | 8 | 25.0% | 3.3 |
| Los Angeles-Long Beach-Anaheim, CA | 17.9% | 1.6% | $1,099,000 | -4.4% | -2.3% | 9 | 15.5% | 1.5 |
| Louisville/Jefferson County, KY-IN | 26.7% | 15.3% | $315,000 | -0.3% | 2.7% | 1 | 23.5% | 0.4 |
| Memphis, TN-MS-AR | 13.1% | 10.7% | $324,200 | -2.4% | -3.3% | 4 | 25.2% | 1.2 |
| Miami-Fort Lauderdale-West Palm Beach, FL | 13.0% | -3.0% | $499,999 | -4.8% | -2.8% | 13 | 16.5% | -0.7 |
| Milwaukee-Waukesha, WI | 3.3% | 6.4% | $389,800 | 1.9% | 4.5% | 0 | 20.0% | 2.9 |
| Minneapolis-St. Paul-Bloomington, MN-WI | 4.4% | 4.3% | $420,000 | -1.2% | -0.2% | -2 | 20.1% | 1.9 |
| Nashville-Davidson–Murfreesboro–Franklin, TN | 17.9% | 6.7% | $536,739 | -0.8% | 0.0% | 7 | 21.3% | 2.7 |
| New York-Newark-Jersey City, NY-NJ | 3.9% | 7.2% | $762,450 | -1.6% | -3.5% | 1 | 9.6% | 0.6 |
| Oklahoma City, OK | 14.5% | 1.7% | $319,400 | 2.3% | 0.1% | 8 | 23.8% | -1.5 |
| Orlando-Kissimmee-Sanford, FL | 10.5% | -7.1% | $419,990 | -1.6% | -2.6% | 12 | 23.1% | -0.4 |
| Philadelphia-Camden-Wilmington, PA-NJ-DE-MD | 10.5% | -0.2% | $379,973 | 1.3% | 0.9% | -1 | 18.3% | 2.3 |
| Phoenix-Mesa-Chandler, AZ | 23.4% | 6.5% | $495,000 | -4.7% | -2.3% | 7 | 29.4% | 0.7 |
| Pittsburgh, PA | 8.0% | 8.2% | $250,000 | 4.2% | 4.2% | 1 | 22.7% | 3.1 |
| Portland-Vancouver-Hillsboro, OR-WA | 13.6% | -6.0% | $599,000 | -0.6% | -1.8% | 10 | 30.9% | 1.9 |
| Providence-Warwick, RI-MA | 11.9% | 0.0% | $582,450 | 5.0% | 3.3% | 0 | 15.1% | -3.9 |
| Raleigh-Cary, NC | 30.6% | 9.7% | $458,020 | 0.2% | -0.7% | 9 | 25.4% | 7.5 |
| Richmond, VA | 22.8% | 7.5% | $429,000 | -2.5% | 0.8% | 4 | 18.3% | 2.9 |
| Riverside-San Bernardino-Ontario, CA | 10.9% | 2.1% | $595,422 | -0.6% | -0.7% | 8 | 17.0% | -0.1 |
| Sacramento-Roseville-Folsom, CA | 14.8% | -3.2% | $610,000 | -2.8% | -1.9% | 9 | 21.8% | 2.5 |
| St. Louis, MO-IL | 11.8% | 9.0% | $295,900 | -1.2% | 3.3% | -1 | 19.4% | 2 |
| San Antonio-New Braunfels, TX | 18.4% | N/A | $329,000 | -1.8% | -3.1% | 4 | 26.5% | 2 |
| San Diego-Chula Vista-Carlsbad, CA | 12.6% | N/A | $927,000 | -5.1% | -2.6% | 5 | 18.1% | 0.3 |
| San Francisco-Oakland-Fremont, CA | 2.3% | -1.8% | $954,500 | -4.0% | -4.2% | 4 | 15.4% | 0.7 |
| San Jose-Sunnyvale-Santa Clara, CA | 9.5% | -6.0% | $1,381,500 | -0.9% | -1.4% | 5 | 15.1% | 2 |
| Seattle |