


new homes
National trends
- Buying: Investor buying remains fairly steady at 10.8% of transactions
-
- 10.8% of homes purchased in Q2 of 2025 were purchased by an investor.
- Slightly fewer homes were bought by investors in Q2 2025 while much fewer total homes were bought, resulting in a higher investor buyer share year over year by 0.1 percentage point.
- Selling: Investor selling activity flattens out
-
- Investor home sales fell 4.1% in Q2, marking a clear slowdown from last year’s rapid pace.
- Investor sellers accounted for 9.2% of all home sales in Q2 2025, unchanged year over year.
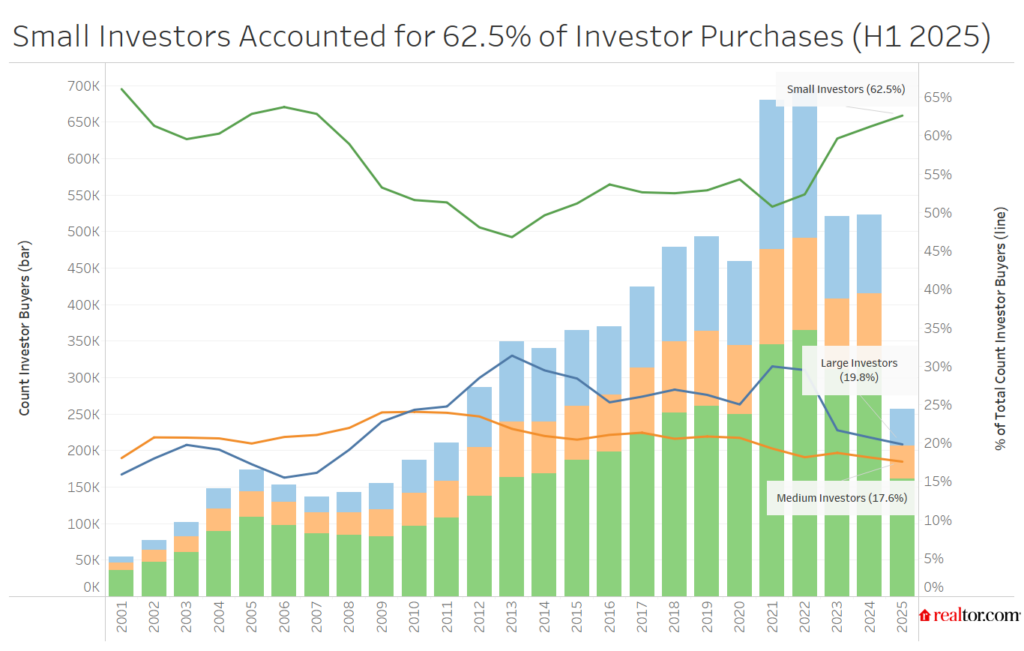
- Sizing: Small investors reach the highest share since 2007 in the first half of 2025
- The small investor share of investor buyers continues to grow while large investor activity falls off, a trend that started in 2022 and has continued through the latest data.
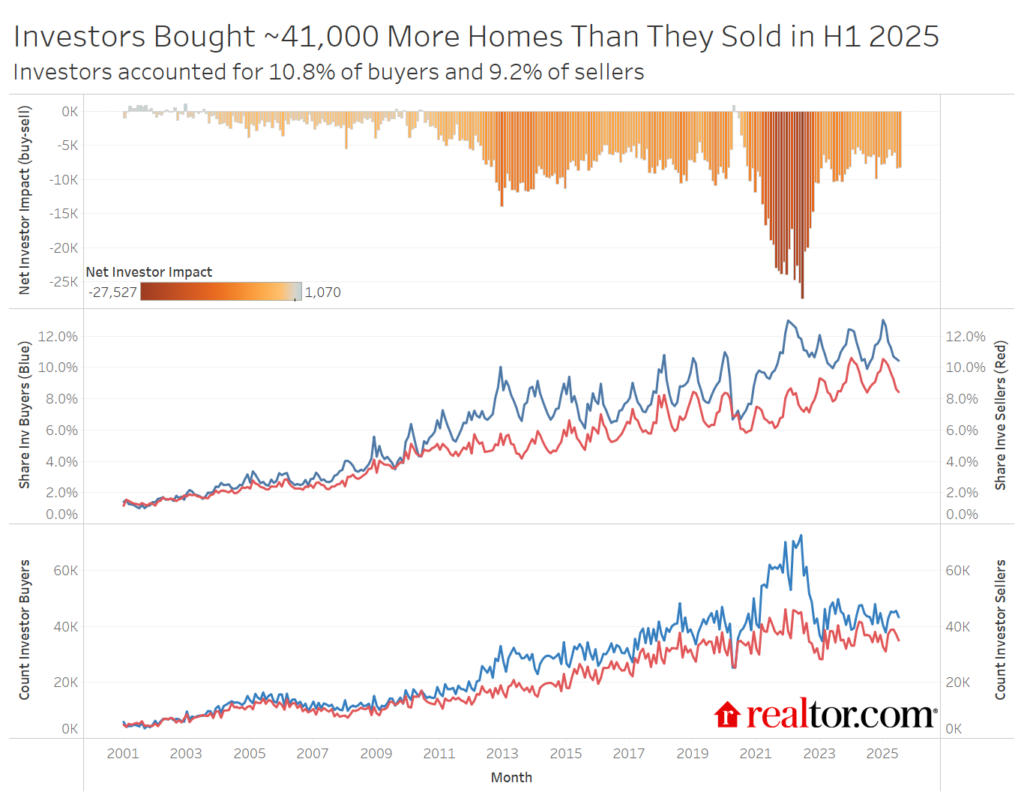
- Net impact: Investor buying continues to outpace investor selling
-
- The net impact of investors shifted slightly more to the buy side year over year in Q2 as investor selling activity pulled back more than investor buying activity.
Regional trends
- States with the most investor buyer activity:
- Missouri (18.9%), Mississippi (17.1%), and Nevada (15.4%) saw the highest investor buyer share of home purchases.
- States where investors see the biggest discount and pay the biggest premium:
- Investors in Michigan, Maryland, and Virginia tend to purchase homes priced further below the median market purchase price. Montana, Utah, and California investors pay the biggest premium.
- Metros with the most investor activity:
- Out of the 50 largest U.S. metros, Memphis, TN, St. Louis, MO, and Oklahoma City, OK, saw the highest investor buyer share.
- Metros where investors see the biggest discount and pay the biggest premium:
- The typical investor home price is much lower than the market purchase price in Detroit, Pittsburgh, Baltimore, Cleveland, and Milwaukee. Investors pay the biggest premium for homes in Los Angeles, San Diego, New York City, San Francisco, and Nashville.
Investor competition has been a mounting challenge for many hopeful homebuyers that reached new heights during the COVID-19 pandemic. With limited inventory, buyers often found themselves competing directly with investors for a small pool of available homes, and investors frequently came out ahead. Since then, the housing market has changed markedly. Inventory levels in many areas have returned to, or even exceeded, pre-pandemic norms, while home price growth has moderated and rent increases have slowed. As of the first half of 2025, investor activity has remained relatively steady compared with 2024.
We use deed data to identify investors. The goal is to get a reading on buy-and-hold, corporate investor activity. The data does not capture mom and pop investors unless they buy using a corporate entity. We also evaluate trends in activity among small-, medium-, and large-sized investors, as well as state- and metro-level trends.
Investors pick up modest share amid low home sales in first half of 2025
Investor purchases fell from about 262,000 in the first half of 2024 to 257,000 in the first half of 2025, a 1.8% decrease. Overall home sales fell by 3.8% in the same time period, resulting in a slight year-over-year increase in the share of investor buyers. Zooming in on just the second quarter, about 136,000 homes were bought by investors, down 2.7% year over year, while overall home sales fell 4.2%, pushing the investor share of sales higher.
In the second quarter of 2025, 10.8% of homes sold were purchased by an investor, up from 10.7% in Q2 of 2024, but still below the Q2 2022 peak of 12.1%. Elevated mortgage rates and relatively stable home prices kept many buyers sidelined, resulting in a sustained investor share of buyers.
Small investors accounted for 62.5% of investor purchases in Q2 of 2025, the second-highest small investor share in the data’s history, behind the first quarter of 2025 (62.7%). Large investor activity fell to 20.1% of investor purchases. Small investors purchased 70,000 homes in Q2 of 2025, up just slightly year over year, reaching the highest number of small investor purchases since Q3 of 2022. Large investors purchased just 19,800 homes, down 13.5% year over year.
Investor seller activity flattens in 2025
After surging by roughly 10% year over year in early 2024, investor selling activity cooled through 2025. Investor home sales fell 3.7% year over year in Q1 2025 and 4.1% in Q2, marking a clear slowdown from last year’s rapid pace. Investor sellers accounted for 9.2% of all home sales in Q2 2025, unchanged from the same period a year earlier. In total, investors sold approximately 216,000 homes in the first half of 2025, down 4% year over year but still well above pre-pandemic levels of around 90,000 homes in H1 2017–19. The average sale price for investor-sold homes stood at $333,000 in Q2 of 2025, or 10.8% below the national median sale amount.
Several factors are contributing to this moderation in investor selling. As both the housing and rental markets recalibrate, investors appear less motivated to offload properties quickly. National housing inventory has risen 15.3% year over year as of September, giving sellers more competition, while rent growth has flattened or softened across many major metros. For many investors, stable rent streams combined with a softer sales environment make holding properties a more attractive short-term strategy than selling in a less competitive market.
Investors still buy more than they sell
Net investor selling activity, defined as the number of investor sellers minus the number of investor buyers, has been negative throughout the data’s history as more investors buy than sell each year in the U.S. This trend held in the first half of 2025 as investors bought roughly 41,000 more homes than they sold, a 10.8% wider gap compared to the first half of 2024 due to easing investor seller activity. In Q2 specifically, investors bought roughly 21,000 more homes than they sold, compared to a 19,800 gap in Q2 2024, reflecting the more significant slowdown in investor seller activity compared to the investor buyer slowdown. The pandemic period saw the most severe difference between investor buying and selling. Since the onset of the pandemic, investors have bought 726,000 more homes than they have sold, which has put pressure on the homeownership rate.
The U.S. continues to grapple with the long-term effects of a housing supply shortage that spans over a decade, now estimated at nearly 4 million homes. While investors help meet rental demand, their activity can constrain for-sale inventory by competing directly with potential homebuyers. In Q2 of 2025, the typical investor purchased a home for $287,000, more than $80,000 below the national median sale price ($372,000 in Q2). This trend highlights how investors tend to concentrate in lower-priced metros and in the lower-priced segments of the market, where homes are more likely to generate positive rental returns. As a result, budget-conscious buyers often find themselves in direct competition with investors for the most affordable properties, a contest many are unable to win.
Rental vacancy rates have climbed across the U.S. over the past year. The South (9%) and Midwest (6.6%) see the highest rental vacancy, while the West (5.7%) and the Northeast (5.2%) still see relatively few empty rentals. However, the South and the Midwest are both still attractive to investors. The highly affordable and in-demand Midwest creates attractive opportunities for investors looking to buy at a low price and see stable rental returns. The housing market in the South has softened significantly, resulting in ample inventory and easing prices, creating opportunities for some investors. However, by and large, investors continue to seek out relatively tight rental markets with high demand as well, especially as would-be homebuyers opt to keep renting until homebuying conditions improve.
Investors pick affordable states for investment
Investors are keenly aware of economic growth and housing demand, but must balance home prices with potential returns. Investors bought the largest share of homes in Missouri (18.9%), Mississippi (17.1%), Nevada (15.4%), Indiana (14.3%), and Alabama (13.4%) in Q2 of 2025. These states are generally affordable but have seen rental prices hold up better than national rents, creating an opportunity for investors. Missouri and Indiana, especially, continue to see strong demand. Nevada in general, and Las Vegas in particular, has seen a significant shift of late as falling demand has resulted in climbing inventory and falling prices. Investors are increasingly taking advantage of this shift.
| State Name | 2025 Q2 Share Investor Buyers | YoY |
| Missouri | 18.9% | 0.6% |
| Mississippi | 17.1% | 2.5% |
| Nevada | 15.4% | 3.8% |
| Indiana | 14.3% | 0.3% |
| Alabama | 14.2% | 0.8% |
| Utah | 14.1% | -0.1% |
| Oklahoma | 13.5% | -1.6% |
| Texas | 13.4% | 0.9% |
| Kansas | 13.3% | 0.4% |
| Hawaii | 13.2% | -1.0% |
Investor strategies vary by location
The gap between the median sale price and the median investor purchase price provides a window into how and where investors choose to deploy capital, revealing their strategies, target segments, and broader affordability dynamics. When investors consistently buy homes well below the state’s median sale price, it suggests they are seeking steady income and long-term appreciation, often focusing on lower-cost or undervalued properties in less-established or secondary markets that offer strong cash flow potential. This pattern typically appears in markets with ample affordable housing stock and solid rent-to-price ratios.
In contrast, when investors pay above the median, it points to a speculative or appreciation-oriented strategy, where buyers are drawn to markets with tight supply, strong price growth, or short-term rental potential. These investors are betting on reliable gains, often concentrating in high-demand or lifestyle-driven regions where competition is fierce, renting is the norm, and affordability pressures are more pronounced.
| State | Investor Buyer Median Purchase Amt | Median Overall Purchase Amt | Investor Purchase Price Diff |
| Michigan | $118,000 | $252,000 | -53.1% |
| Maryland | $231,000 | $424,000 | -45.4% |
| Virginia | $230,000 | $418,000 | -45.0% |
| Delaware | $238,000 | $407,000 | -41.4% |
| Wisconsin | $175,000 | $296,000 | -40.7% |
The states where investors pay the least relative to the median purchase amount are Michigan (-53.1%), Maryland (-45.4%), Virginia (-45%), Delaware (-41.4%), and Wisconsin (-40.7%). These large negative gaps highlight potential affordability stress for households, since investors are competing for entry-level, affordable housing stock. This trend also highlights potential displacement pressure in lower-cost markets where investor activity disproportionately targets low-priced inventory. These ultralow investor home purchase prices signal that investors in these markets are prioritizing low-entry-cost markets with solid rent-to-price ratios.
| State | Investor Buyer Median Purchase Amt | Median Overall Purchase Amt | Investor Purchase Price Diff |
| Montana | $574,000 | $425,000 | 35.1% |
| Utah | $667,000 | $499,000 | 33.7% |
| California | $909,000 | $737,000 | 23.3% |
| New York | $554,000 | $493,000 | 12.3% |
| Vermont | $382,000 | $370,000 | 3.2% |
The states where investors are paying the most over the median sale price include Montana (+35.1%), Utah (+33.7%), California (+23.3%), New York (+12.3%), and Vermont (+3.2%). This trend could signal a few different things. Both Montana and Utah have seen surging luxury demand over the past few years, which could contribute to investor activity concentrating on the high end, specifically as investors target potential short-term rental properties. In California and New York, above-median purchases may cluster in high-barrier, high-rent metros where even investor “entry-level” homes are expensive. Vermont’s smaller premium suggests more niche investment in vacation rental or second-home markets. Put differently, these investors aren’t bargain hunters; they’re buying access to constrained, high-demand markets.
Metro-level trends
Affordable metros see strong investor activity
Out of the 50 largest U.S. metros, Memphis, TN, St. Louis, MO, and Oklahoma City, OK, saw the highest investor buyer share. The top 10 markets for investor buyers are all in the South and Midwest, the most affordable U.S. regions. These areas have been investor favorites for some time, topping the list in 2024 as well. The Midwest boasts low entry prices and strong demand, while the South offers ample inventory and easing prices. Investor buyer activity grew year over year in these markets while overall buyer activity fell, yielding a higher share of investor buyers.
| Metro | 2025 Q2 Inv Buyer Share | YoY |
| Memphis, TN-MS-AR | 25.2% | 4.7% |
| St. Louis, MO-IL | 20.6% | 1.1% |
| Kansas City, MO-KS | 19.3% | 1.7% |
| San Antonio-New Braunfels, TX | 18.0% | 3.7% |
| Birmingham, AL | 17.6% | 1.1% |
| Las Vegas-Henderson-North Las Vegas, NV | 16.8% | 3.9% |
| Columbus, OH | 16.4% | 6.0% |
| Dallas-Fort Worth-Arlington, TX | 16.1% | 2.4% |
| Oklahoma City, OK | 15.5% | -3.2% |
| Indianapolis-Carmel-Greenwood, IN | 15.1% | 1.1% |
Investor strategies vary by locale
Similar to the state-level trends, investors tend to take a different approach depending on local market dynamics. This means that in some areas, investors target properties well below the median market price, while in others, investors pay a premium. Investors in Detroit, Pittsburgh, Baltimore, Cleveland, and Milwaukee tend to buy homes priced furthest below the market median. These five Midwestern locales have much in common, including affordable home prices, steady demand, and a history of strong rental markets anchored by stable, blue-collar employment and relatively low housing costs.
These metros have long attracted investors seeking reliable cash flow rather than rapid appreciation, thanks to modest purchase prices and rent-to-price ratios that outperform national averages. Based on June 2025 rent levels, the five metros that see investors pay the most below the typical buyer also see the highest rent-to-price ratios. Many of these markets also have older housing stock and pockets of underinvestment, creating opportunities for value-add renovations and long-term rental strategies. As a result, investor activity in these metros tends to reinforce their role as income-oriented, yield-driven markets, where affordability and steady tenant demand outweigh short-term price gains.
| Metro | Investor Buyer Median
Purchase Amt |
Median Overall Purchase Amt | Investor Purchase Price Diff |
| Detroit-Warren-Dearborn, MI | $106,000 | $252,000 | -58.0% |
| Pittsburgh, PA | $115,000 | $243,000 | -52.7% |
| Baltimore-Columbia-Towson, MD | $186,000 | $387,000 | -52.0% |
| Cleveland, OH | $113,000 | $233,000 | -51.4% |
| Milwaukee-Waukesha, WI | $164,000 | $328,000 | -50.1% |
Investors pay the biggest premium for homes in Los Angeles, San Diego, New York City, San Francisco, and Nashville. The top four markets share high home prices, high demand, and high rent prices. Investors can count on strong rental demand as entry-level homes remain unaffordable to many households in these metros. The outsized premium in Los Angeles may reflect the lingering effects of recent wildfires in the area, whose impact continues to ripple through the housing market. Nashville, while more affordable than the coastal hubs, mirrors their dynamic with rapid population growth, a vibrant job market, and expanding demand for both long-term and short-term rentals.
Across these metros, investors are paying premiums not just for the properties themselves, but also for access to constrained, high-demand housing ecosystems where supply struggles to keep up with population and income growth. These premium purchases reflect confidence in future appreciation and sustained rent growth, even amid elevated entry costs. In effect, investors in these cities are betting that strong urban economies and persistent affordability barriers for would-be homeowners will continue to fuel robust rental returns and long-term home price appreciation.
| Metro | Investor Buyer Median Purchase Amt | Median Overall Purchase Amt | Investor Purchase Price Diff |
| Los Angeles-Long Beach-Anaheim, CA | $1,198,000 | $1,000,000 | 19.8% |
| San Diego-Chula Vista-Carlsbad, CA | $990,000 | $907,000 | 9.2% |
| New York-Newark-Jersey City, NY-NJ | $741,000 | $682,000 | 8.7% |
| San Francisco-Oakland-Fremont, CA | $1,296,000 | $1,213,000 | 6.8% |
| Nashville-Davidson–Murfreesboro–Franklin, TN | $477,000 | $462,000 | 3.4% |
Looking ahead
As of July 2025, data suggests that investor buying activity continues to edge higher as a share of total home purchases. In July, investors bought 0.7% fewer homes than a year earlier, but overall home sales declined by a steeper 5.7% during the same period. This divergence pushed the investor share of home purchases up from 9.9% in July 2024 to 10.4% in July 2025. Persistently high home prices and mortgage rates continue to constrain typical buyers, helping keep investor participation elevated.
While widespread economic uncertainty could introduce some volatility, investors are still likely to focus on markets that offer a combination of affordability and steady housing demand. Although national rent growth has cooled, declining construction activity could tighten future rental supply, creating renewed opportunities for investors to capture unmet rental demand.
Methodology
In this analysis, we examined deed records dating from January 2000 to July 2025 nationally, at the state level, and in the 50 largest U.S. metros. We included only single-family homes, condos, townhomes, and row houses, and we excluded multifamily buildings, which is not a market the typical homebuyer is competitive in. We attempt to capture business-oriented, buy-and-hold investor purchases, excluding buyers with an established flipping-oriented business model. Some flipping activity is likely included as it is not always clear upfront whether an investor purchase is intended for a flip or buy-and-hold. We define an investor as a buyer or seller that was/is an absentee owner and that has a name that includes the following: LLP, LP, LLC, GP, or TRUST. In addition to this broad definition, we also exclude keywords and sale types relating to homebuilders, relocation service companies, government bodies, and financial institutions. Data limitations mean that this analysis excludes small investors not registered under a company name. Census estimates show that in 2021, 37.1% of rental units were owned by individual investors, while 48.7% of units were owned by Trustees, LLP, LP, or LLC, General Partnership, Real Estate Investment Trust, or Real Estate Corporation. Ownership entity for more than half of the remaining units was not reported.
Appendix
State Investor Data
| State Name | 2025 Q2 Share Investor Buyers | YoY | 2025 Q2 Count Inv. Buyers | YoY | 2025 Q2 Median Investor Purchase Amt | 2025 Q2 Median Sale Amt | Inv. vs. Overall Sale Amt Gap |
| USA | 10.8% | 0.1% | 135,920 | -2.7% | $287,000 | $370,000 | -22.4% |
| Alabama | 14.2% | 0.8% | 3,172 | -0.6% | $172,000 | $243,000 | -29.4% |
| Alaska | 6.3% | 1.3% | 190 | 33.8% | $331,000 | $403,000 | -18.1% |
| Arizona | 12.3% | 2.1% | 4,624 | 22.5% | * | $448,000 | * |
| Arkansas | 11.1% | 0.4% | 1,348 | -5.2% | $184,000 | $248,000 | -26.1% |
| California | 8.2% | 0.9% | 7,162 | 9.3% | $909,000 | $737,000 | 23.3% |
| Colorado | 8.5% | -1.2% | 2,431 | -12.2% | $513,000 | $547,000 | -6.2% |
| Connecticut | 7.1% | 0.6% | 671 | 9.6% | $327,000 | $415,000 | -21.3% |
| Delaware | 8.9% | -3.3% | 383 | -28.4% | $238,000 | $407,000 | -41.4% |
| District of Columbia | 10.1% | 2.2% | 186 | 25.7% | $715,000 | $699,000 | 2.2% |
| Florida | 11.1% | -0.5% | 12,881 | -14.3% | $349,000 | $383,000 | -8.7% |
| Georgia | 9.0% | -0.2% | 4,339 | -8.0% | $311,000 | $348,000 | -10.5% |
| Hawaii | 13.2% | -1.0% | 524 | -21.4% | $707,000 | $697,000 | 1.5% |
| Idaho | 11.1% | -0.7% | 1,280 | -2.4% | $409,000 | $423,000 | -3.2% |
| Illinois | 8.5% | 0.0% | 3,626 | -6.4% | $224,000 | $303,000 | -26.3% |
| Indiana | 14.3% | 0.3% | 5,015 | -4.0% | $153,000 | $252,000 | -39.3% |
| Iowa | 9.8% | -0.9% | 1,544 | -8.3% | $137,000 | $223,000 | -38.4% |
| Kansas | 13.3% | 0.4% | 1,538 | 7.3% | $237,000 | $299,000 | -20.9% |
| Kentucky | 11.7% | -0.1% | 1,845 | -13.6% | $192,000 | $253,000 | -23.8% |
| Louisiana | 11.2% | -1.5% | 1,449 | -14.8% | $142,000 | $238,000 | -40.5% |
| Maine | 9.2% | -0.3% | 357 | -7.8% | $399,000 | $395,000 | 1.0% |
| Maryland | 10.3% | -1.1% | 2,317 | -13.0% | $231,000 | $424,000 | -45.4% |
| Massachusetts | 7.1% | 0.1% | 1,335 | 3.2% | $559,000 | $632,000 | -11.5% |
| Michigan | 7.7% | 0.4% | 2,674 | 0.1% | $118,000 | $252,000 | -53.1% |
| Minnesota | 6.9% | -1.2% | 1,591 | -14.2% | $280,000 | $338,000 | -17.4% |
| Mississippi | 17.1% | 2.5% | 1,322 | 8.8% | $256,000 | $271,000 | -5.5% |
| Missouri | 18.9% | 0.6% | 6,534 | 2.2% | $194,000 | $268,000 | -27.8% |
| Montana | 12.5% | -0.1% | 704 | 4.0% | $574,000 | $425,000 | 35.1% |
| Nebraska | 7.6% | 1.4% | 658 | 12.7% | $212,000 | $278,000 | -23.8% |
| Nevada | 15.4% | 3.8% | 2,494 | 32.5% | * | $487,000 | * |
| New Hampshire | 6.2% | -1.9% | 243 | -25.7% | $384,000 | $483,000 | -20.4% |
| New Jersey | 13.1% | 1.6% | 3,511 | 14.7% | $420,000 | $532,000 | -21.0% |
| New Mexico | 9.4% | -0.5% | 824 | -10.3% | $282,000 | $326,000 | -13.6% |
| New York | 10.3% | 0.7% | 3,249 | 2.7% | $554,000 | $493,000 | 12.3% |
| North Carolina | 11.7% | -1.0% | 6,276 | -14.2% | $253,000 | $356,000 | -28.8% |
| North Dakota | 9.5% | -2.3% | 310 | -23.1% | $258,000 | $286,000 | -9.9% |
| Ohio | 12.0% | 1.4% | 5,048 | 8.6% | $152,000 | $243,000 | -37.7% |
| Oklahoma | 13.5% | -1.6% | 2,074 | -18.3% | $136,000 | $227,000 | -39.9% |
| Oregon | 5.3% | 0.1% | 769 | -1.3% | $413,000 | $493,000 | -16.2% |
| Pennsylvania | 11.6% | 0.0% | 4,642 | -4.9% | $172,000 | $285,000 | -39.8% |
| Rhode Island | 7.2% | -0.2% | 189 | 1.1% | $391,000 | $467,000 | -16.3% |
| South |