

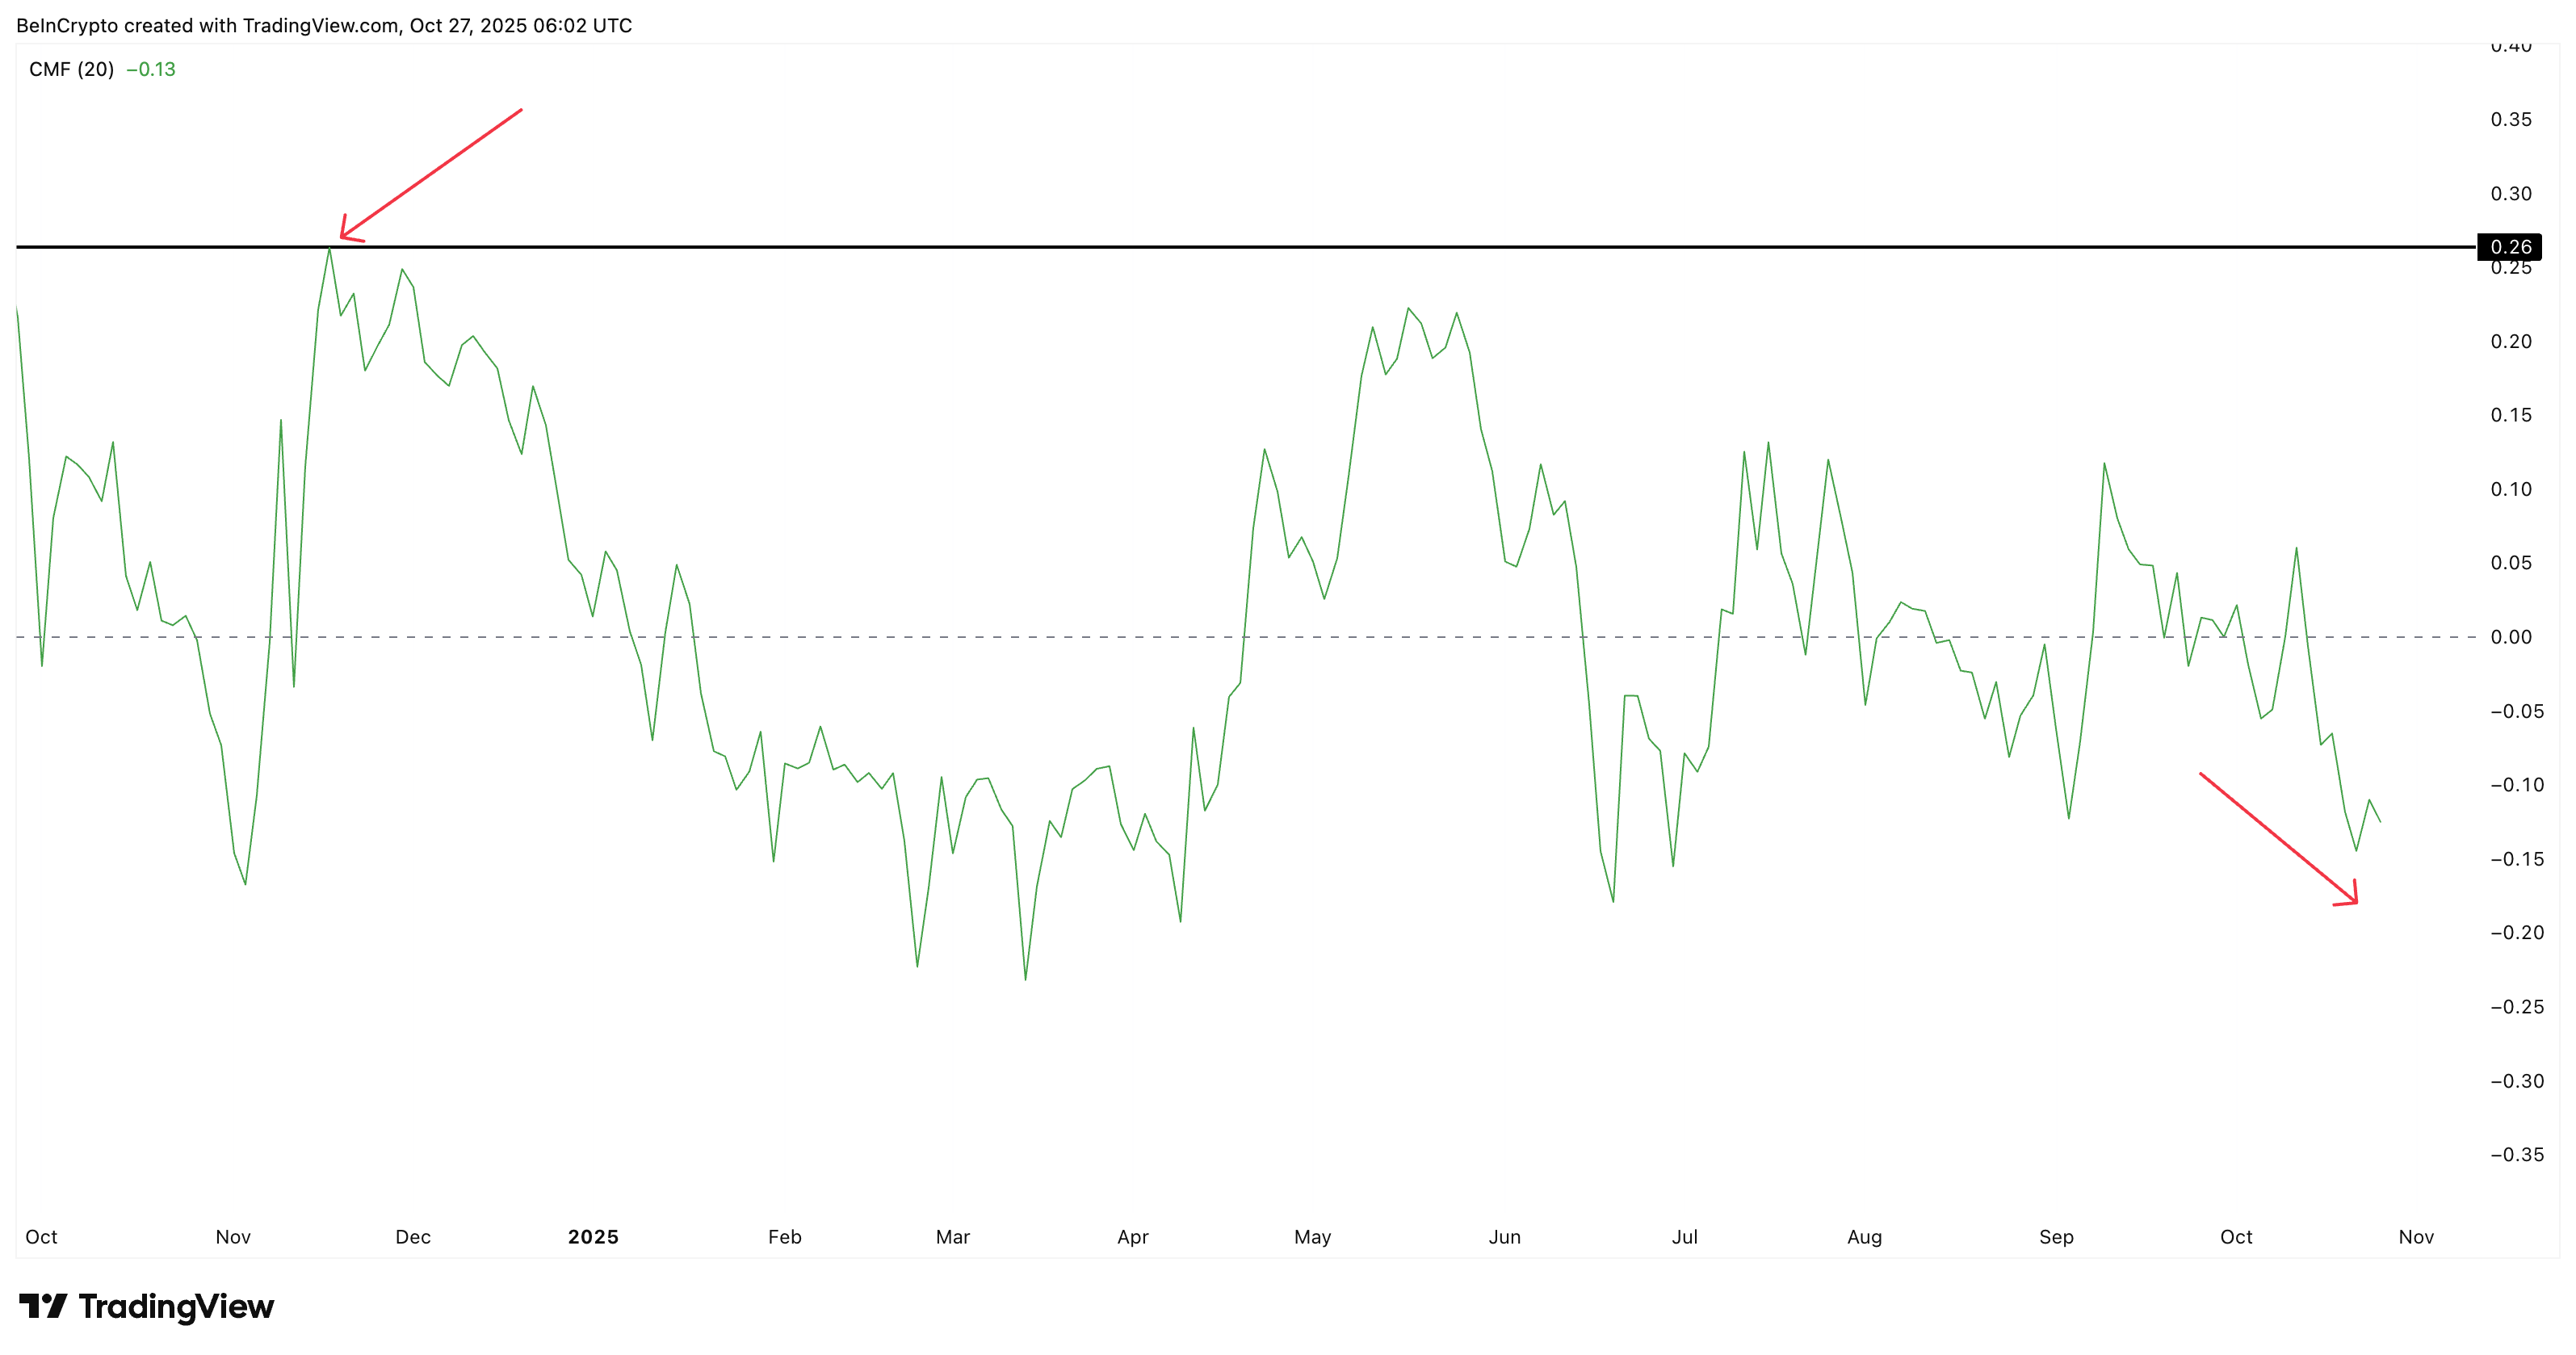
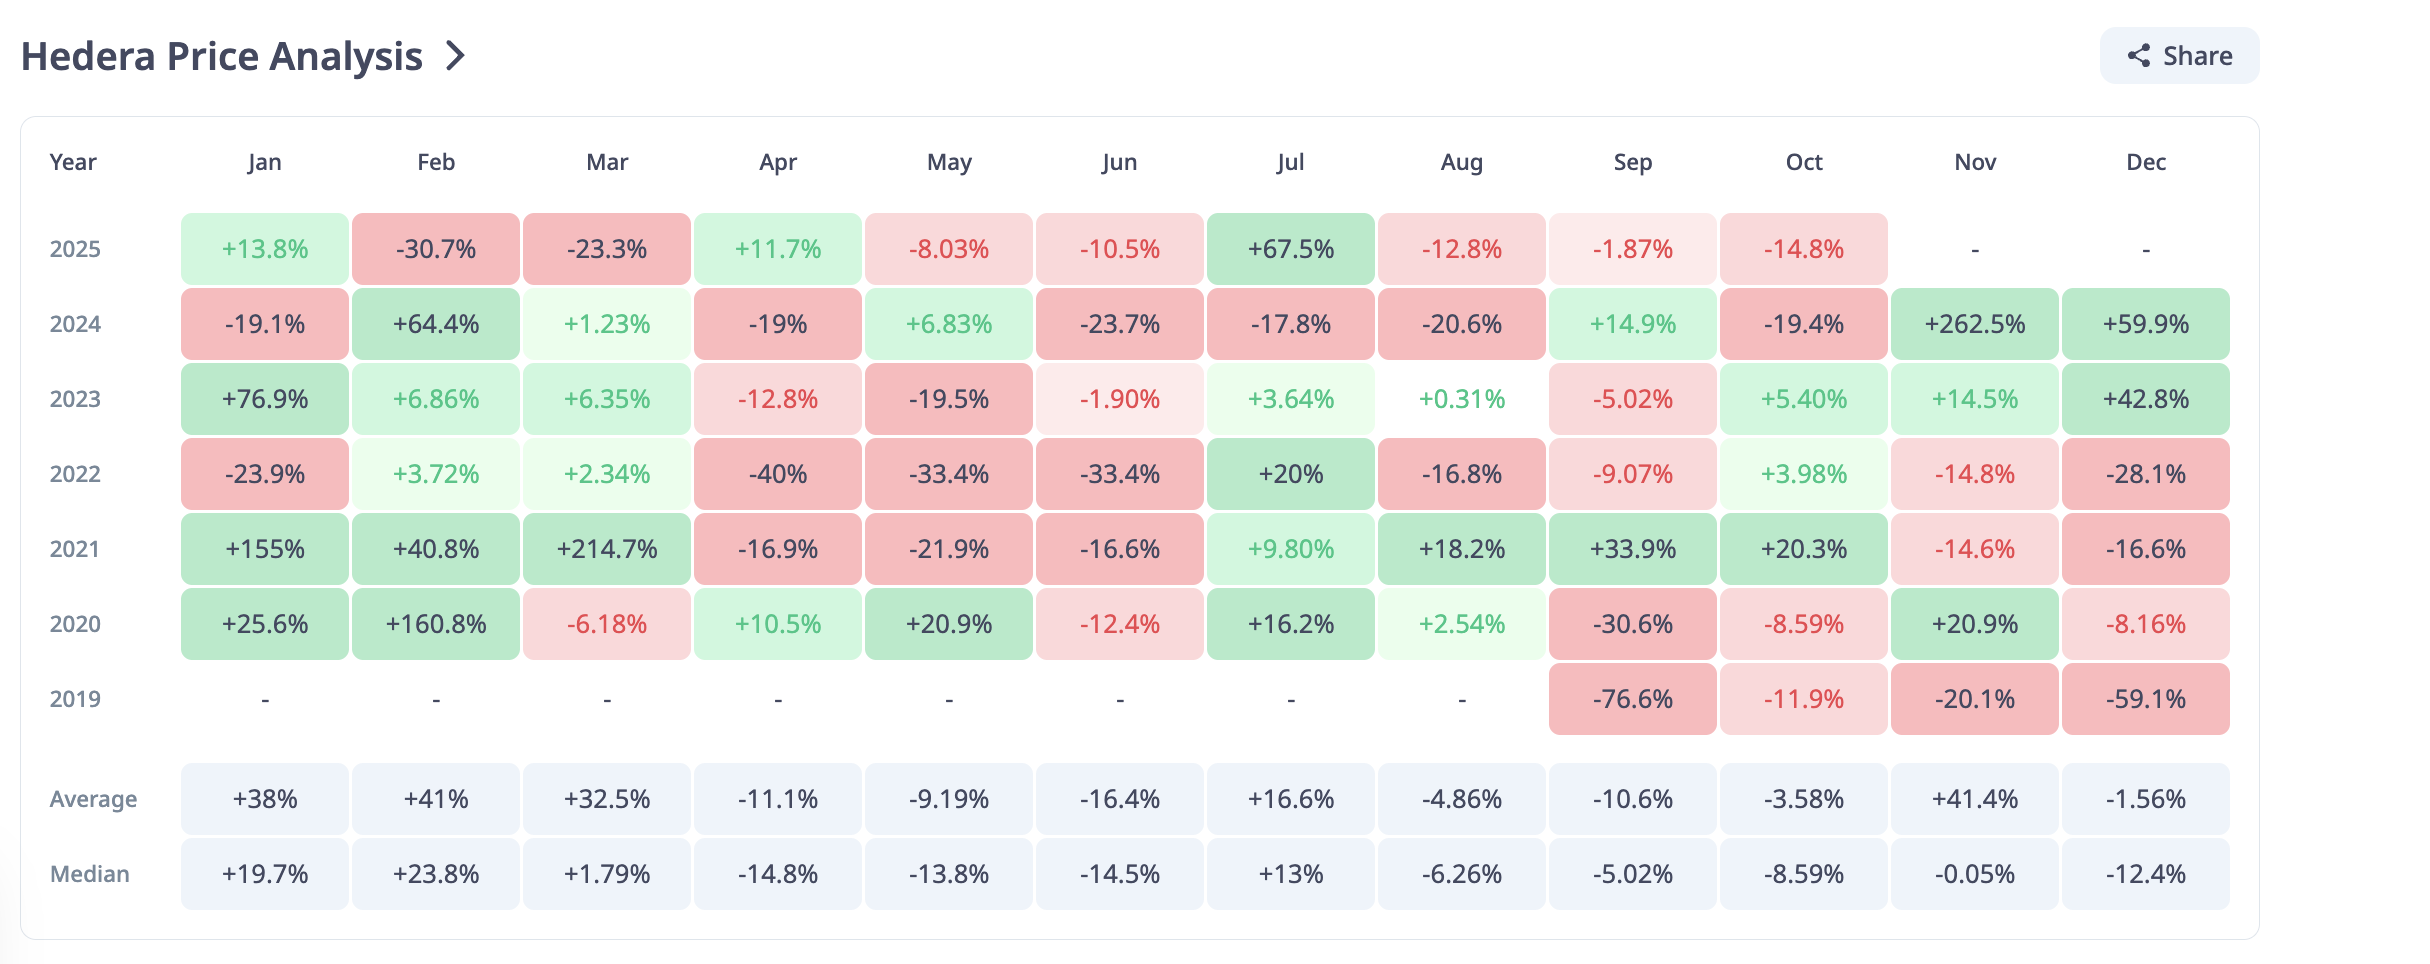
- HBAR’s November track record shows an average 41% rise, but its current CMF versus last year signals weak big-money inflows this time.
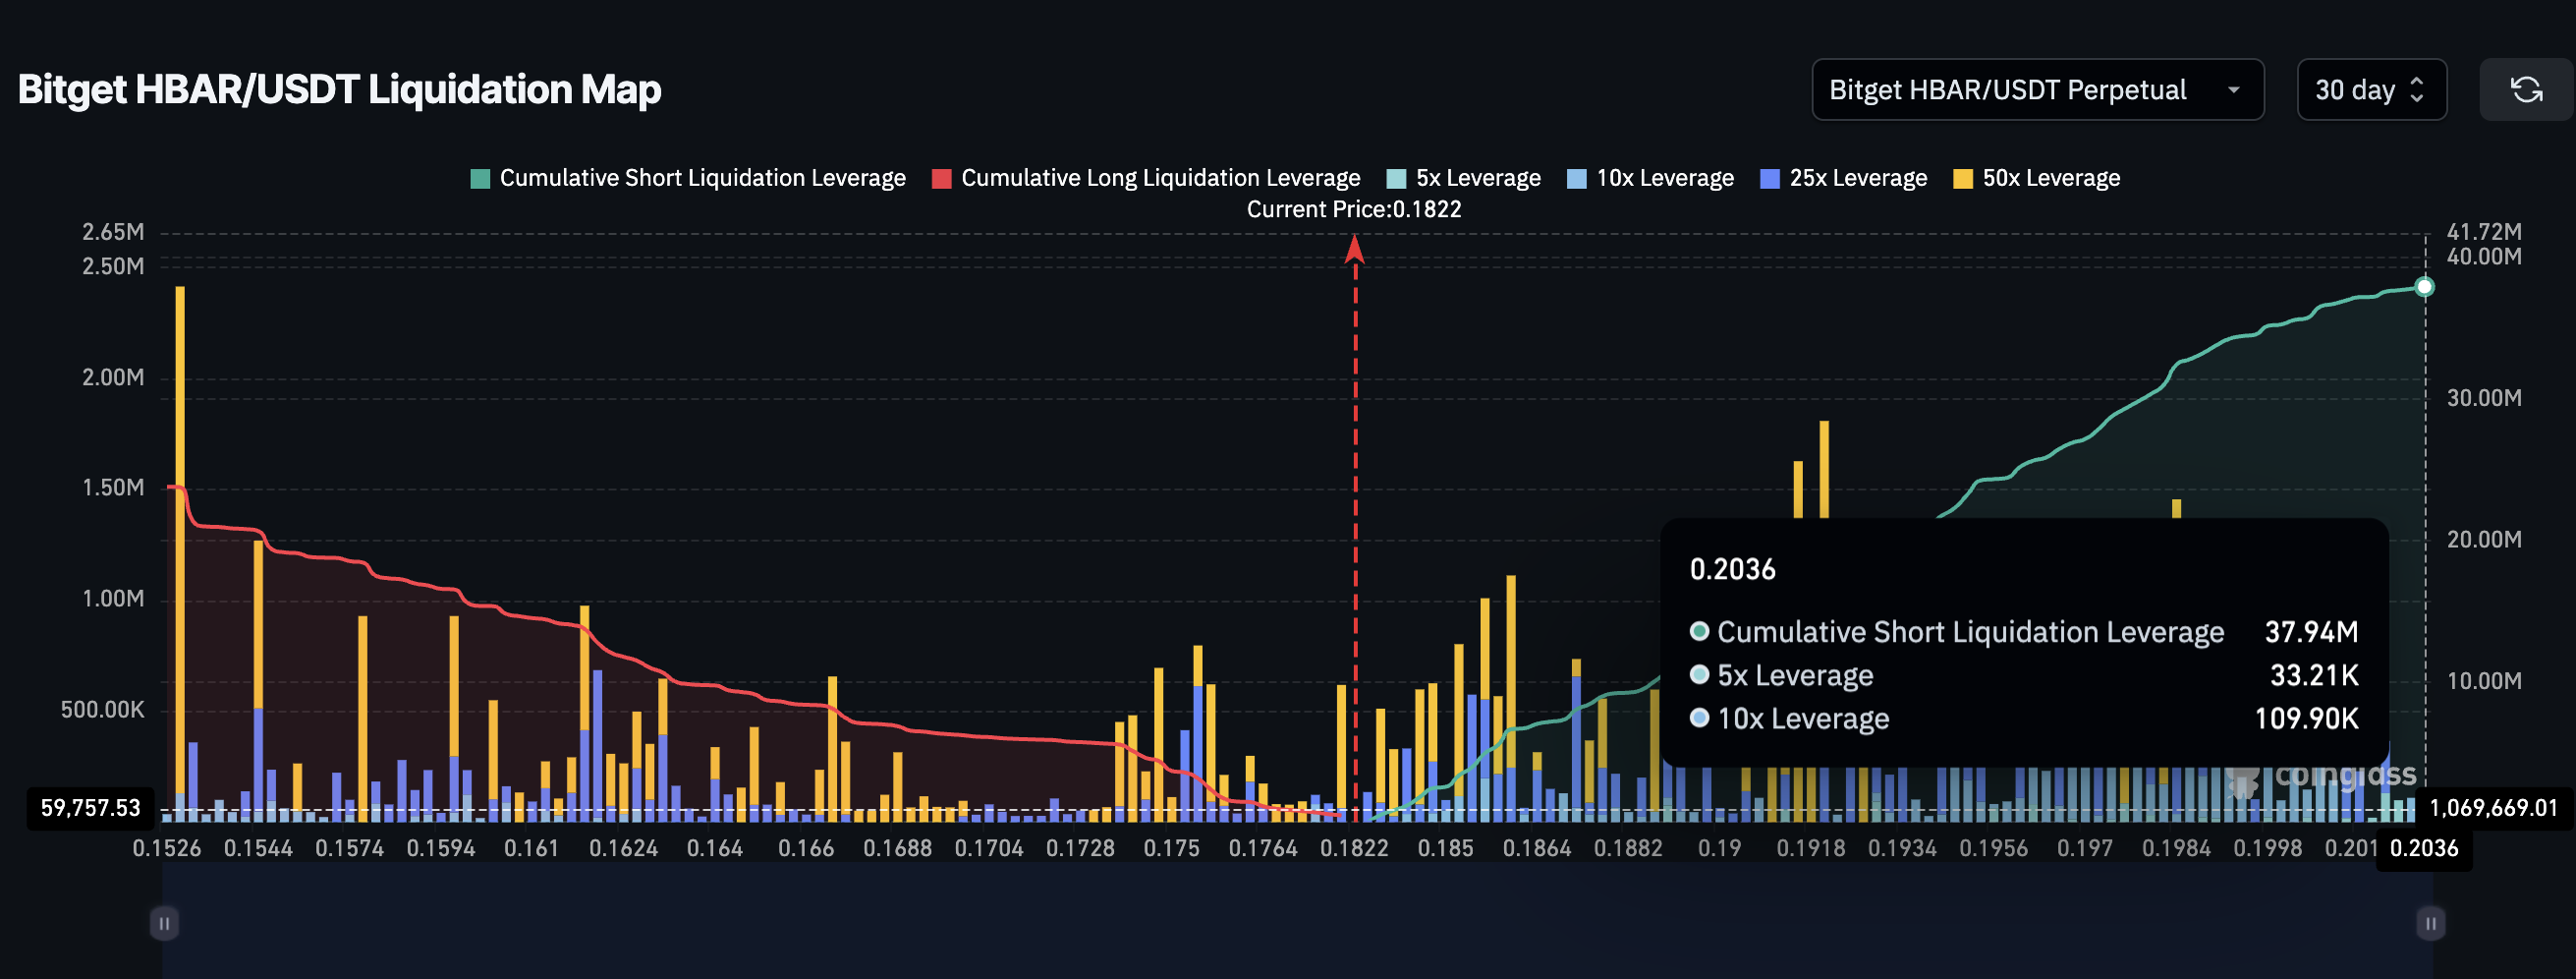
- With $37.94 million in shorts and $23.78 million in longs, any dovish FOMC signal could trigger short liquidations and fuel a move toward $0.22–$0.26.
- A hidden bearish divergence on the two-day chart shows sellers still active. A close above $0.20 would confirm breakout targets.
Hedera (HBAR) traders are heading into November with mixed expectations. The token has dropped 32.6% over the past three months, weighed down by broader market caution, but HBAR price history says the next few weeks could look very different.
November has been one of Hedera’s best-performing months on record, gaining 14.5% in 2023 and an incredible 262.5% in 2024. With the FOMC meeting wrapping up on October 29 and possible rate cuts in sight, traders are wondering whether another big move could be brewing for November.
Sponsored
Weak Big-Money Backing Despite Strong Historical Record
Over the years, HBAR has shown a strong seasonal bias for November rallies. But this time, it’s missing one critical element — whale support.
The Chaikin Money Flow (CMF), an indicator that tracks how much capital is entering or exiting the market, sits at –0.13 on the daily chart. A positive CMF shows money flowing in, but negative readings mean investors are pulling funds out.
Want more token insights like this? Sign up for Editor Harsh Notariya’s Daily Crypto Newsletter here.
Last November, CMF hovered near +0.26, a sign of strong institutional buying. The current downtrend shows that large investors are still holding back.
Despite that, HBAR’s long-term data shows an average November gain of 41%, keeping optimism alive if the macro setup turns supportive after the Fed meeting.
Sponsored
Short Liquidations Could Trigger a Sharp Move Upward
While big money remains quiet, the derivatives market is heating up. According to Bitget’s liquidation map, shorts have built up roughly $37.94 million in open positions, while longs hold $23.78 million. There is a nearly 50% gap in favor of bearish bets.
Most of these short clusters sit between $0.18 and $0.19, right around HBAR’s current range. If prices rise slightly after the FOMC meeting, especially if the Fed confirms a dovish tone or a rate cut, it could trigger a short squeeze, forcing bearish traders to buy back into the market.
Sponsored
That kind of derivatives-led rally could set off a quick move toward $0.22 or even $0.26. The latter would mark gains of up to 44% from current levels.
HBAR Price Action and Divergence Hint at Early Indecision
On the two-day chart, HBAR is still moving inside a symmetrical triangle, a neutral pattern that often leads to large breakouts (or breakdowns) once the price escapes the range.
However, between October 12 and October 26, the price made lower highs, while the Relative Strength Index (RSI), a tool measuring buying versus selling pressure, formed higher