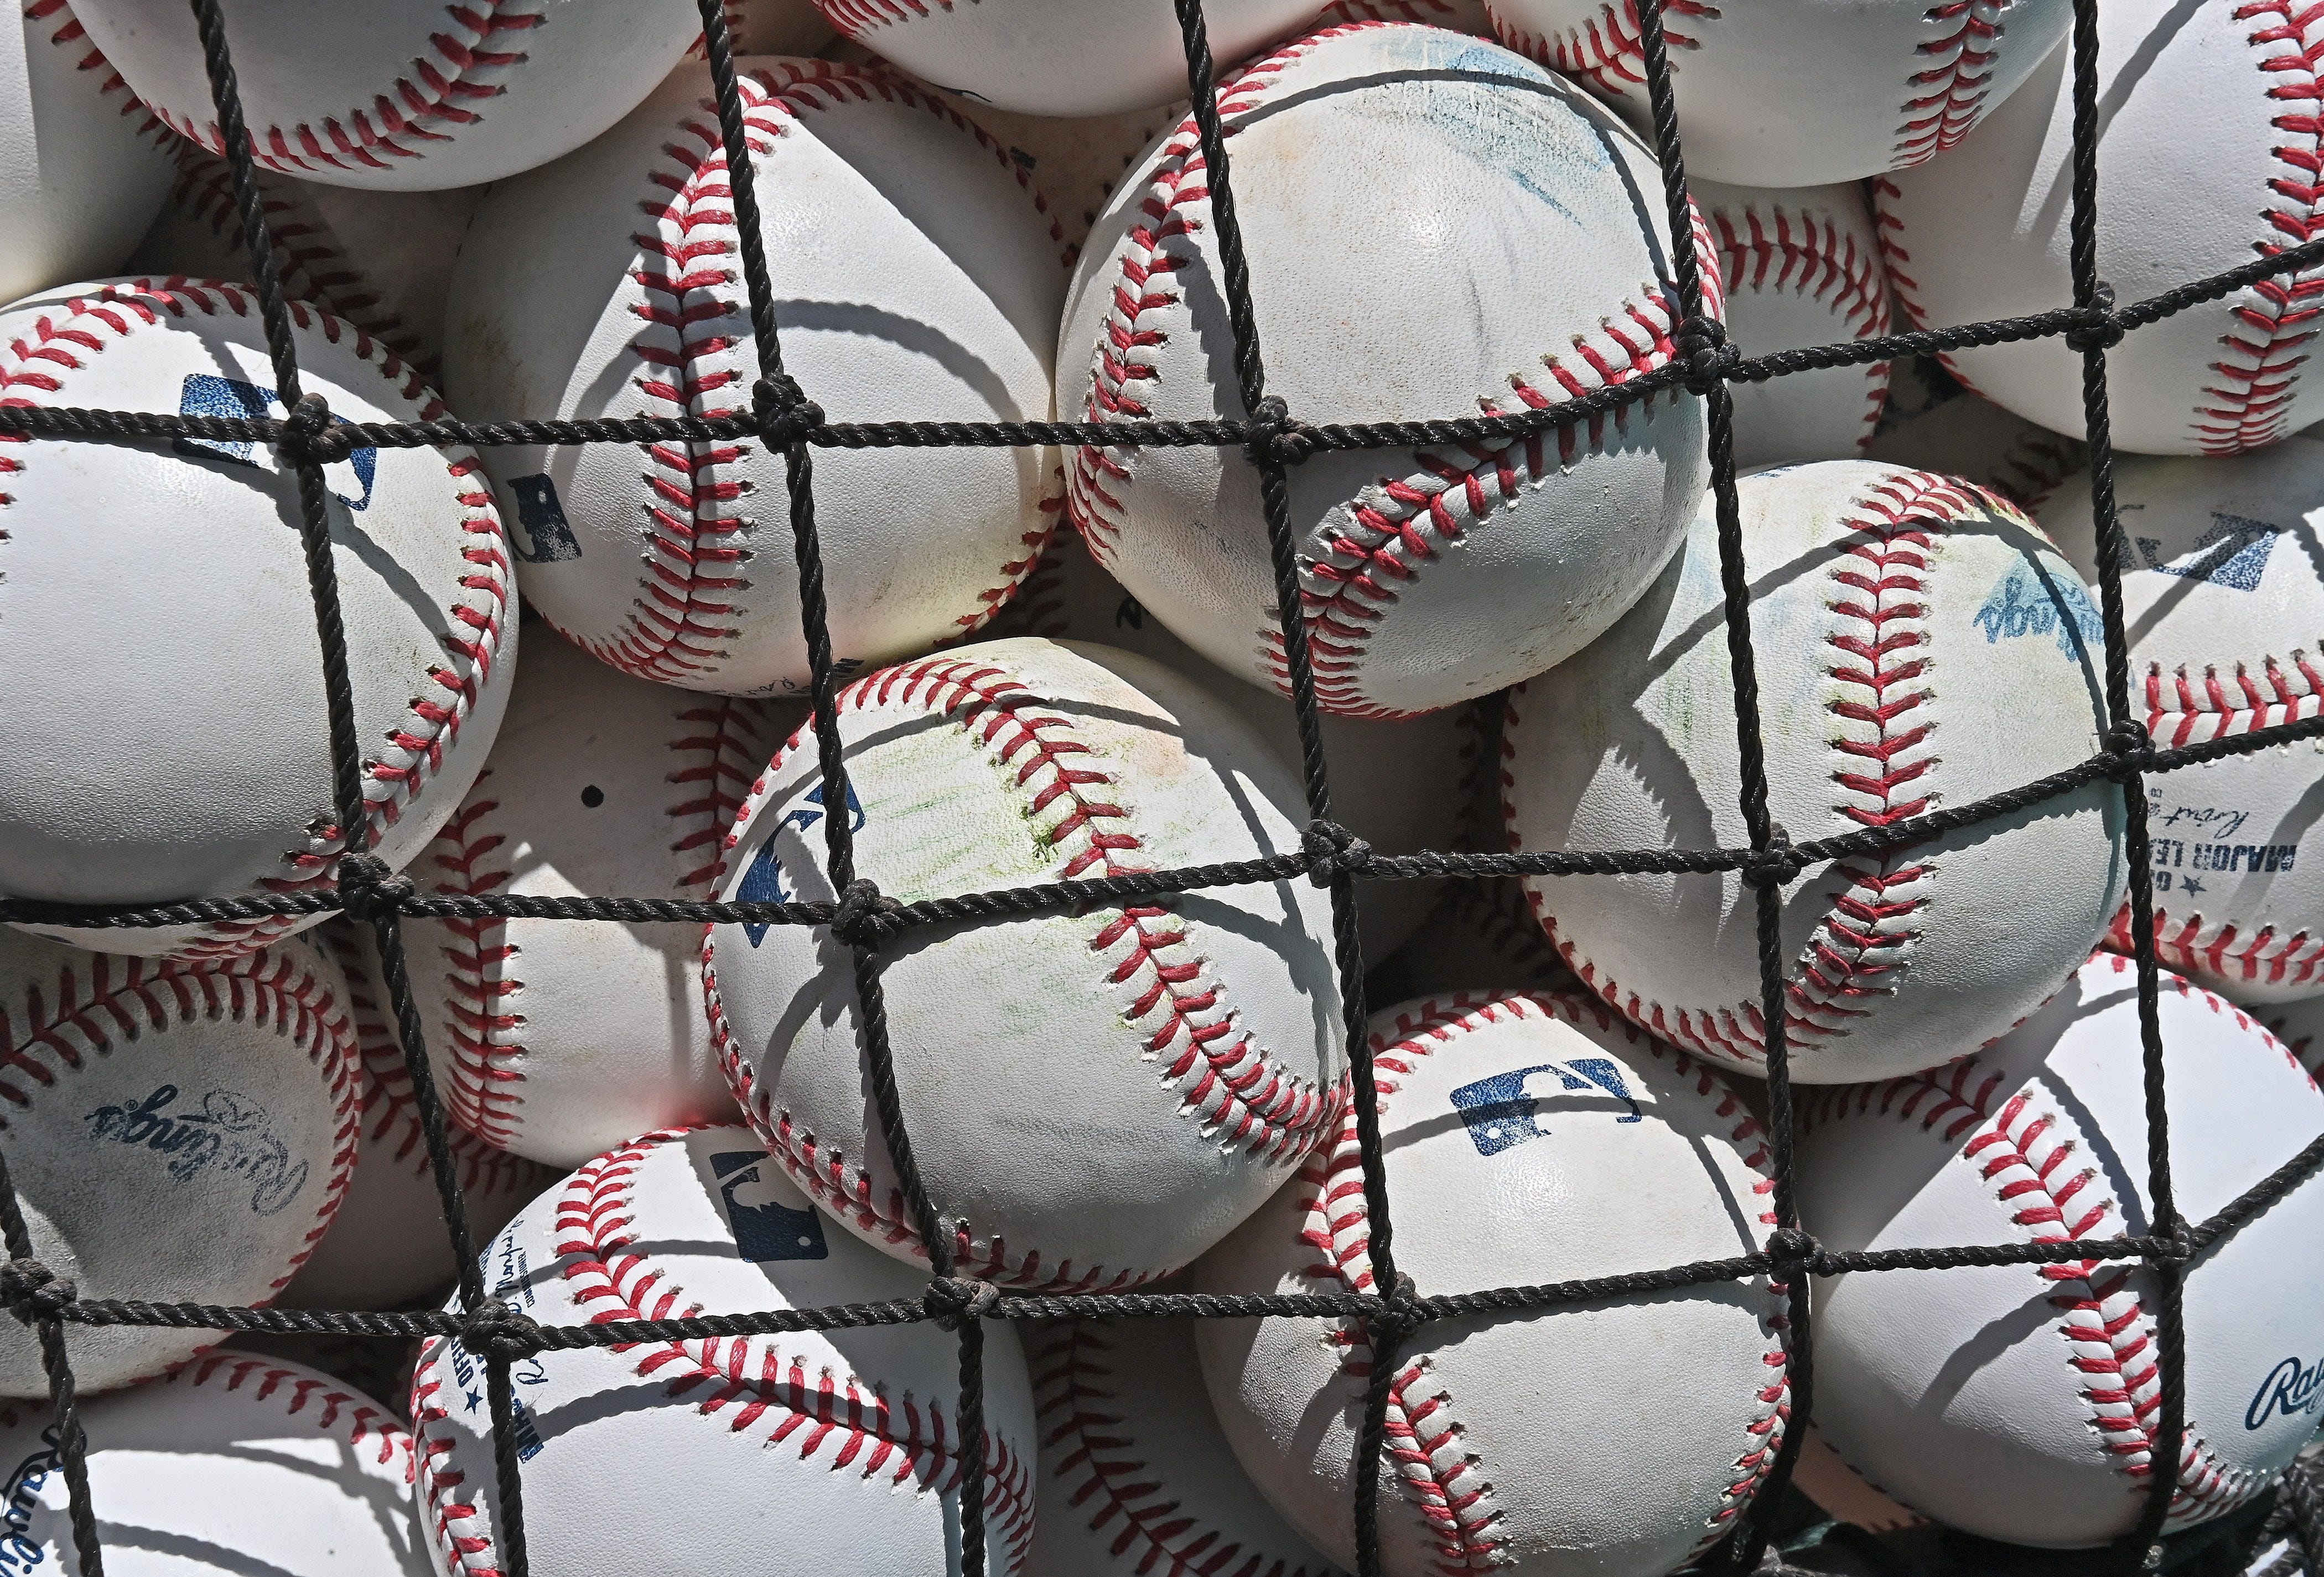
Despite MLB’s public pronouncements that the baseballs will be more uniform this season because all 30 parks are using humidors for storage, the results on the field seem to tell a different story.
For the first month or so of the 2022 regular season, balls weren’t flying as far as they did a year ago. That was in line with MLB’s plan to encourage hitters to put more balls in play and not just swing for the fences. The numbers fell in line, with home runs hit at roughly 35% below their expected rate, according to the research site BallparkPal.com.
Then something seemed to change – almost overnight.
For the first month of the season, actual HRs were about 35% below expected, which tracks with the introduction of this year’s dead ball.
However, it appears some clear change took place around May 14th that gave the ball about a 10-15 point boost: pic.twitter.com/VtNq6F4Z83
— Ballpark Pal (@BallparkPal) June 4, 2022
Around May 14, home run rates jumped roughly 10 to 15 percentage points over what batted ball data would have projected. They’ve maintained that level over the course of the last month of games. And it’s not because of warmer weather; that’s already factored in.
Could a difference in the properties of the baseball be the culprit? MLB has a history of changing the ball in the middle of the season without telling anyone. Thanks to the work of researchers Dr. Alan Nathan, Dr. Meredith Wills and others, we now know a lot more about the impact even the slightest changes can have on how the ball flies.
League-wide slugging before May 14 was a paltry .375, but in games since then (through June 12) it jumped to .410. However, the expected league-wide slugging percentage was exactly same (.438) both before and after.
Also, when batters hit fly balls in the early part of the season, they ended up as home runs 10.3% of the time. Since May 14, they’ve left the yard at a 12.2% clip. (Over those same dates in 2021, the gap was much smaller – 13.1% vs. 13.9%.)
But all fly balls aren’t the same. Let’s look at balls hit at the optimal angle and exit velocity to produce home runs, which Statcast classifies as “barrels.” Jon Anderson of Rotoballer recently broke down how often those barreled balls have gone for homers this season – with the numbers staying even in April, increasing slightly in early May and jumping significantly right around that May 14-15 weekend.
HR/Brl by Half-Month (the percent of barrels that go for a homer)
April 7th – April 19th: 46.6%
April 20th – April 30th: 46.3%
May 1 – May 15th: 50.8%
May 16th – May 31st: 57.5%
June 1st – June 8th: 58.8%— Jon Anderson (@JonPgh) June 9, 2022
Taking his idea a step further, I looked at the HR/barrel rate from the April 7 start of the season through May 13. It was 47.2%. From May 14 through Sunday’s games, it rose to 59.0%.
(Last year, using the same dates, the difference was much smaller: 56.1% vs. 59.8%. And just for fun, during 2019’s home run explosion, the rates were 71.1% and 76.9%!)
The obvious question now is … where do we go from here? Will the fly-ball hitters who struggled earlier in the year begin to thrive again? Will we see an even livelier ball in over the summer? Or will the humidors have the opposite effect in the hottest and stickiest months by taking moisture out of the baseball?
Unfortunately, this kind of analysis usually leads to more questions than answers. For now, just being aware of the prevailing batted-ball trends may be the best we can do.
Pitchers finally getting healthy
In-season injuries can be devastating to MLB and fantasy teams alike. However, there’s also a sense of excitement when those injured players return to the active ranks.
Right now, several high-level starting pitchers have just come off the injured list


