


Highlights
- Nationwide asking rent continues its 29-month streak of year-over-year declines. The median asking rent across the 50 largest U.S. metropolitan areas was $1,689, down 0.7% from December 2024.
- All unit sizes experienced rent declines again this month, although studio units are experiencing a less significant decline than 1- and 2-bedroom units, and are closer to being flat year over year.
- While median rent has grown 16.9% since December 2019, the 25th percentile of asking rent has grown 19.9% and the 75th percentile just 12.5%. This puts disproportionate pressure on the lowest earners to afford their rent while higher-end renters are enjoying the majority of recent rent declines.
Market summary
Median asking rent across the 50 largest metropolitan areas of the country fell again in December, to $1,689. This marks a 0.7% decrease from last year at this time, the smallest year-over-year decline since March. Annual rent declines have been flattening out at the end of 2025 after more significant declines during the summer months. The consistency of the rent decline trend is remarkable: This is the 29th consecutive month in which rent has fallen year over year.

The current December readout is the lowest since 2021, in the midst of the dramatic rent run-up that the market is still recovering from. Rents tend to bottom out in the winter months when fewer people are starting new leases and rise in the spring and summer, but this effect was muted in 2025 when the largest year-over-year rent declines occurred during the peak season.
Breaking the national median down by unit size shows a mostly consistent pattern across all types of rental inventory: 0-, 1-, and 2-bedroom units all saw rent declines of 1% or less. Studio units had the smallest decline, while 2-bedroom units had the largest.
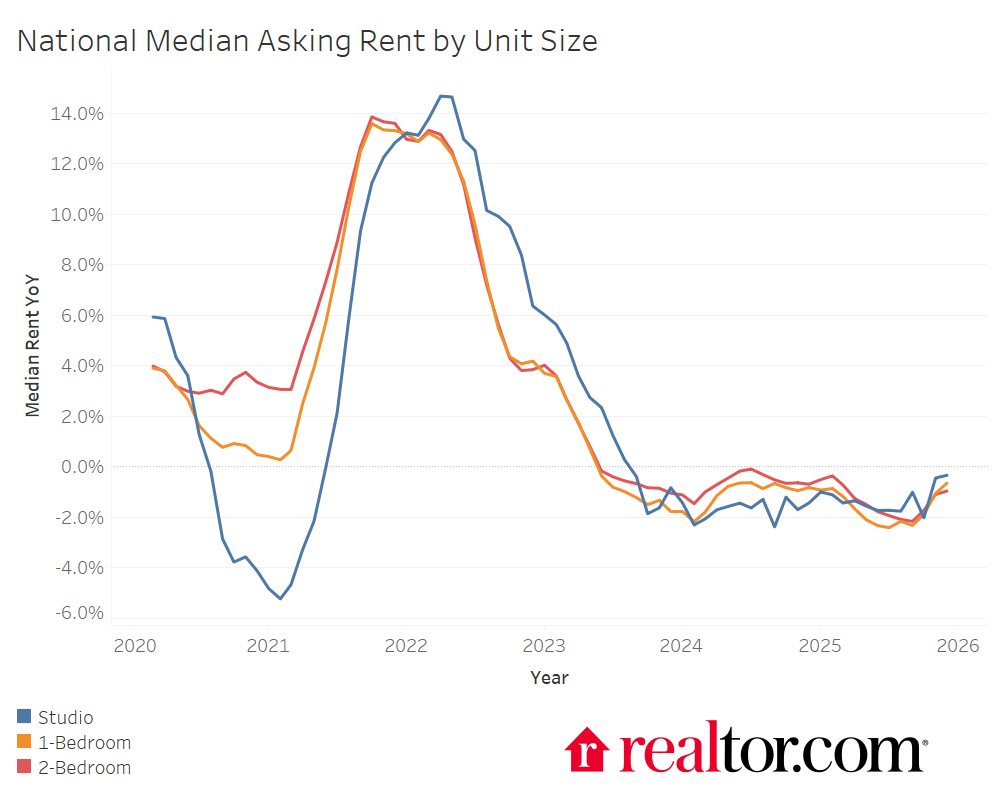
Studio rents starting to recover was a theme for much of 2025, which is an encouraging sign for household formation across the country. Studios are often the first type of rental chosen by someone leaving their family home or a unit-sharing roommate scenario, so increased demand for this segment suggests that more young people are striking out on their own.
Rent relief is concentrated at the top of the distribution
Our analysis of rental trends primarily focuses on asking rent at the median, which is a good way to capture overall movement in the market, but it does not tell the whole story. Rents are distributed widely around the median, and the upper and lower segments of the market are capable of moving in different ways than the middle. As we showed last month, rental affordability is especially challenging (though improving) for lower-income renters, so it’s important to consider the set of rental options available below the median. At the same time, to understand what is actually changing in the market as a whole requires an understanding of rents at the higher end of the distribution.
To illustrate rent changes beyond the median, we look at the 25th and 75th percentiles of rent as well, comparing how rents at those points of the price distribution have changed since the COVID-19 pandemic. Despite softening in recent years, median rent has increased by 16.9% from December 2019 to December 2025. The upper and lower quartiles, though, tell a different story.
What we see across the country since 2019 (and especially since the rent peak in 2022) is a compression of asking rents, with the 25th percentile growing by 19.9% over this six-year period and the 75th percentile growing by just 12.5%. This is due to both a stronger run-up in lower-priced rentals as well as a more modest recent decline.
Less expensive rentals saw stronger price growth than pricier ones, gaining 21% from 2019 to 2022 compared to 19.6% for the median and just 16.5% for the pricier 75th percentile. Furthermore, the softness at the top of the market is primarily what is driving down the median. Those renters in higher-cost units have seen the bulk of the rent relief since 2023, while those in low-cost units have seen very little of it. From December 2022, pricier rentals have fallen 3.5% in price compared with 2.3% for the median and just 0.8% for the 25th percentile. This helps to answer the question we often hear: “If median rent is falling, why do low-income renters continue to struggle?” It also sheds light on demand softness in the for-sale market, as renters of high-end units feel very comfortable remaining renters.
This compression of rents is not uniform across the 50 largest metropolitan areas. The first table below shows the five metros where the 25th percentile rent has grown the most as a percentage of the median rent, and the second shows the five metros where the 25th percentile rent has fallen the most as a percentage of the median. The metros in the first table are the ones where the bottom of the rent distribution has grown the most, making them the most difficult to afford for low-income renters. The metros in the second table are those where it has actually become relatively easier for low-income renters to afford the less costly rentals in the metro.
Metros With the Most Rent Compression Below the Median Since 2019
| Metro | Dec 2019 – 25th Percentile Rent as Percentage of Median | Dec 2025 – 25th Percentile Rent as Percentage of Median | Difference |
| Boston-Cambridge-Newton, MA-NH | 79.2% | 86.1% | 7.0pp |
| Nashville-Davidson–Murfreesboro–Franklin, TN | 79.3% | 86.1% | 6.8pp |
| Atlanta-Sandy Springs-Roswell, GA | 79.8% | 85.9% | 6.1pp |
| Chicago-Naperville-Elgin, IL-IN | 75.2% | 80.5% | 5.3pp |
| Baltimore-Columbia-Towson, MD | 78.6% | 83.8% | 5.2pp |
Metros With the Least Rent Compression Below the Median Since 2019
| Metro | Dec 2019 – 25th Percentile Rent as Percentage of Median | Dec 2025 – 25th Percentile Rent as Percentage of Median | Difference |
| Cleveland, OH | 79.9% | 74.5% | -5.4pp |
| New York-Newark-Jersey City, NY-NJ | 78.3% | 75.3% | -2.9pp |
| Birmingham, AL | 83.3% | 80.6% | -2.7pp |
| Detroit-Warren-Dearborn, MI | 80.9% | 78.6% | -2.2pp |
| Cincinnati, OH-KY-IN | 78.7% | 77.3% | -1.5pp |
Methodology
Rental data as of November 2025 for studio, 1-bedroom, or 2-bedroom units advertised for rent on Realtor.com. Rental units include apartments as well as private rentals (condos, townhomes, single-family homes). We use rental sources that reliably report data each month within the 50 largest metropolitan areas. Realtor.com began publishing regular monthly rental trends reports in October 2020 with data history stretching to March 2019.
Appendix
| Metro | Median Asking Rent (0-2 Bedrooms – Dec 2025) | YoY Rent Change | Dec 2019 – 25th Percentile Rent as Percentage of Median | Dec 2025 – 25th Percentile Rent as Percentage of Median | Difference |
| Atlanta-Sandy Springs-Roswell, GA | $1,533 | -2.6% | 79.8% | 85.9% | 6.1pp |
| Austin-Round Rock-San Marcos, TX | $1,390 | -5.3% | 82.6% | 82.5% | -0.1pp |
| Baltimore-Columbia-Towson, MD | $1,825 | 1.8% | 78.6% | 83.8% | 5.2pp |
| Birmingham, AL | $1,191 | -2.3% | 83.3% | 80.6% | -2.7pp |
| Boston-Cambridge-Newton, MA-NH | $2,844 | -3.4% | 79.2% | 86.1% | 7.0pp |
| Buffalo-Cheektowaga, NY | NA | NA | NA | NA | NA |
| Charlotte-Concord-Gastonia, NC-SC | $1,491 | -2.0% | 82.7% | 86.3% | 3.6pp |
| Chicago-Naperville-Elgin, IL-IN | $1,799 | 0.0% | 75.2% | 80.5% | 5.3pp |
| Cincinnati, OH-KY-IN | $1,317 | -1.5% | 78.7% | 77.3% | -1.5pp |
| Cleveland, OH | $1,257 | 3.6% | 79.9% | 74.5% | -5.4pp |
| Columbus, OH | $1,186 | 0.1% | 81.0% | 85.3% | 4.3pp |
| Dallas-Fort Worth-Arlington, TX | $1,424 | -1.5% | 80.4% | 84.1% | 3.8pp |
| Denver-Aurora-Centennial, CO | $1,756 | -3.6% | 84.7% | 83.8% | -0.9pp |
| Detroit-Warren-Dearborn, MI | $1,306 | -0.9% | 80.9% | 78.6% | -2.2pp |
| Hartford-West Hartford-East Hartford, CT | $1,862 | 5.7% | 81.5% | 83.9% | 2.5pp |
| Houston-Pasadena-The Woodlands, TX | $1,348 | -2.4% | 78.4% | 82.1% | 3.7pp |
| Indianapolis-Carmel-Greenwood, IN | $1,298 | 1.0% | 80.8% | 83.3% | 2.6pp |
| Jacksonville, FL | $1,468 | -2.9% | 80.1% | 85.1% | 5.0pp |
| Kansas City, MO-KS | $1,398 | 3.4% | 79.9% | 82.1% | 2.2pp |
| Las Vegas-Henderson-North Las Vegas, NV | $1,438 | -2.1% | 81.4% | 86.4% | 4.9pp |
| Los Angeles-Long Beach-Anaheim, CA | $2,767 | -1.0% | 80.3% | 81.8% | 1.5pp |
| Louisville/Jefferson County, KY-IN | $1,258 | -0.9% | 83.4% | 82.5% | -0.9pp |
| Memphis, TN-MS-AR | $1,152 | -1.9% | 78.0% | 78.0% | 0.0pp |
| Miami-Fort Lauderdale-West Palm Beach, FL | $2,262 | -3.4% | 81.3% | 84.2% | 3.0pp |
| Milwaukee-Waukesha, WI | $1, |