
What does the data show?
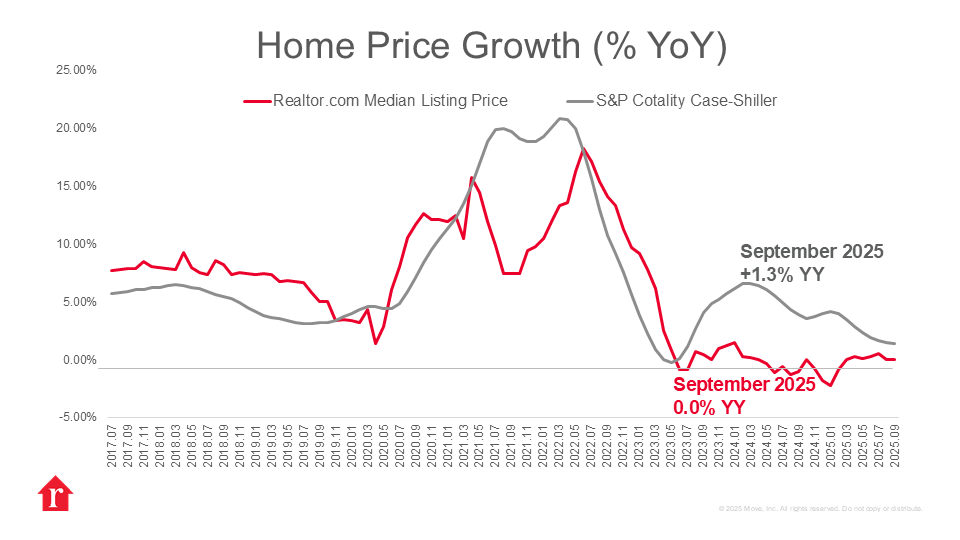
The S&P CoreLogic Case-Shiller U.S. National Home Price NSA Index posted a 1.3% annual gain in September, slowing from 1.4% in the prior month and marking the weakest year-over-year performance since mid-2023. The report reflects closings from July through September, a period defined by steady but elevated mortgage rates that hovered near 6.3%.
Home price growth continued to lag overall inflation, with September’s CPI outpacing housing appreciation by 1.7 percentage points, the most significant gap since the measures began diverging in June. Monthly data signal broad softening as well: all 20 metros recorded month-over-month declines before seasonal adjustment, indicating that higher mortgage rates are now outweighing the support provided by limited inventory.
How did trends vary by region?
The modest decline in mortgage rates from earlier in the year has encouraged some buyer activity, with existing-home sales rising in October for the fourth consecutive month. However, sticky home prices and high borrowing costs continue to strain affordability, keeping home sales at historically low levels. The market is adjusting unevenly, with regional dynamics continuing to diverge sharply. Regional results underscore a widening split between resilient Northeastern and Midwestern metros and weakening markets across the Sun Belt and West. Among the 20 tracked cities, Chicago posted the most substantial annual growth at 5.5%, followed by New York (5.2%) and Boston (4.1%). These markets continue to benefit from tighter resale supply and more stable underlying demand. Lower rates of price reductions and limited inve