Dogecoin (DOGE) price left meme coin enthusiasts rather elated in these seven days as the altcoin completed a 42% rally.
But with the rise comes the potential for correction, and for the first time in 2024, the DOGE sell signal is at its strongest.
Dogecoin Holders Still Betting on a Rise
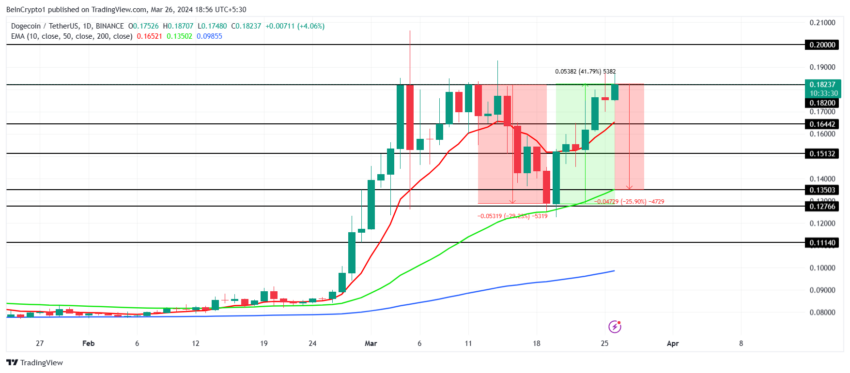
As the Dogecoin price made its way up on the chart, it left behind a rally huge enough to recover the losses witnessed by investors during mid-March. The 42% increase covered up the 26% crash, bringing DOGE closer to reaching $0.20.
This instilled confidence among DOGE holders, who seem to be extremely bullish towards the coin. The same is evinced by the Open Interest, which refers to the total number of outstanding derivative contracts. These open contracts witnessed a 66% surge of $600 million as the altcoin consists mostly of long positions – hinting at a potential increase in price.

Read More: How To Buy Dogecoin (DOGE) With eToro: A Complete Guide
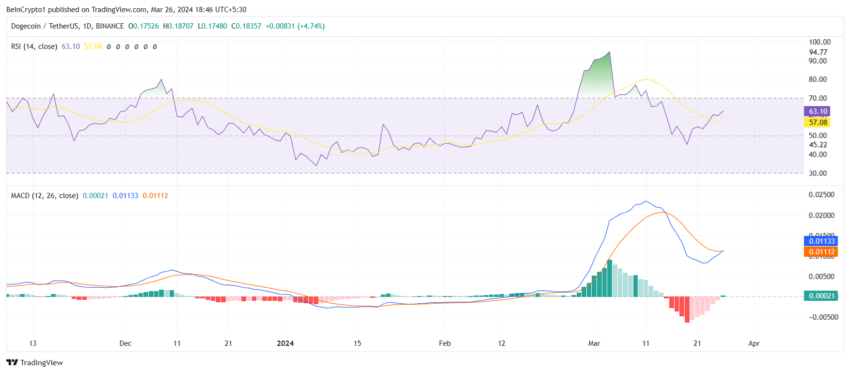
Secondly, technical indicators paint a bullish picture, too. The Relative Strength Index (RSI), which measures the speed and change of price movements, is in the bullish neutral zone. Furthermore, the Moving Average Convergence Divergence (MACD), a trend-following momentum indicator, also notes a bullish crossover.

These indicators hint at further growth in Dogecoin price.
DOGE Price Prediction: Sell Signal Suggests Drop
Dogecoin price, by and large, seems to be suggesting an increase in price is likely. If DOGE continues on this path and manages to flip the $0.182 resistance into support, it will be able to chart a rise to $0.20, marking a two-year high.

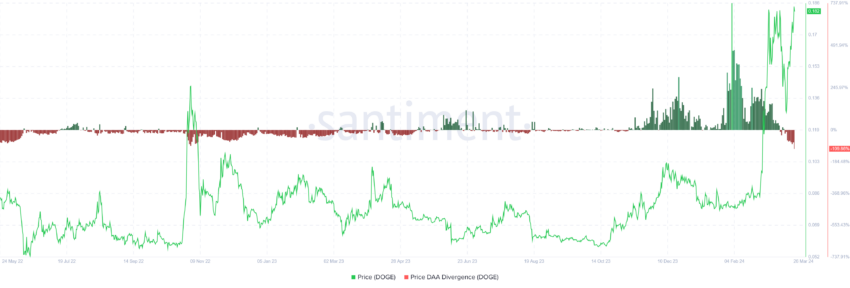
However, price daily average addresses (DAA) divergence is signaling a sell signal. This metric compares changes in the price of an asset with the number of new addresses interacting with it. This indicates potential discrepancies between price movement and user adoption or network activity.

Read More: Dogecoin (DOGE) vs Shiba Inu (SHIB): What’s the Difference?
In the past, whenever this metric triggered a sell signal, the Dogecoin price witnessed a correction. Considering this is the first this year and a rather major one, DOGE could correct significantly. The meme coin could drop through $0.164 and tag $0.151, which would invalidate the bullish thesis and cause a 26% decline to $0.135.
Disclaimer
In line with the Trust Project guidelines, this price analysis article is for informational purposes only and should not be considered financial or investment advice. BeInCrypto is committed to accurate, unbiased reporting, but market conditions are subject to change without notice. Always conduct your own research and consult with a professional before making any financial decisions. Please note that our Terms and Conditions, Privacy Policy, and Disclaimers have been updated.


